Sell Through Rate Calculator: Measure Product Performance and Inventory Efficiency
Understanding how quickly your inventory sells is crucial for smart business decisions. Our sell-through rate calculator shows you exactly what percentage of your available stock is moving to customers during any time period, helping you avoid overstock, optimize purchasing, and identify top performers at a glance.
Understanding Sell-Through Rate and Why It Matters
Sell-through rate measures the percentage of inventory sold compared to what was available during a specific time frame. Think of it as your inventory’s report card; it shows how efficiently you’re converting stock into revenue.
When you calculate the sell-through rate regularly, you gain visibility into several critical aspects of your business:
- Inventory health: Quickly spot products that aren’t moving as expected before they become a financial burden
- Cash flow optimization: Money tied up in unsold inventory is money that could be working harder elsewhere in your business
- Buying decisions: Historical sell-through data guides smarter purchasing quantities and timing
- Promotional effectiveness: Track whether marketing campaigns actually move the needle on product velocity
- Seasonal patterns: Identify trends that help you prepare for peak and slow seasons
A healthy sell-through rate typically falls between 50-80% for most retail categories, though this varies by industry. Luxury goods might see lower rates, while fast-fashion or perishable items should aim higher. The key is establishing your baseline and watching for deviations that signal opportunity or concern.
How the Sell Through Rate Formula Works
The sell-through rate formula is refreshingly simple, which makes it powerful for daily use. At its core, you’re comparing what sold against what was available to sell.
Here’s the basic calculation:
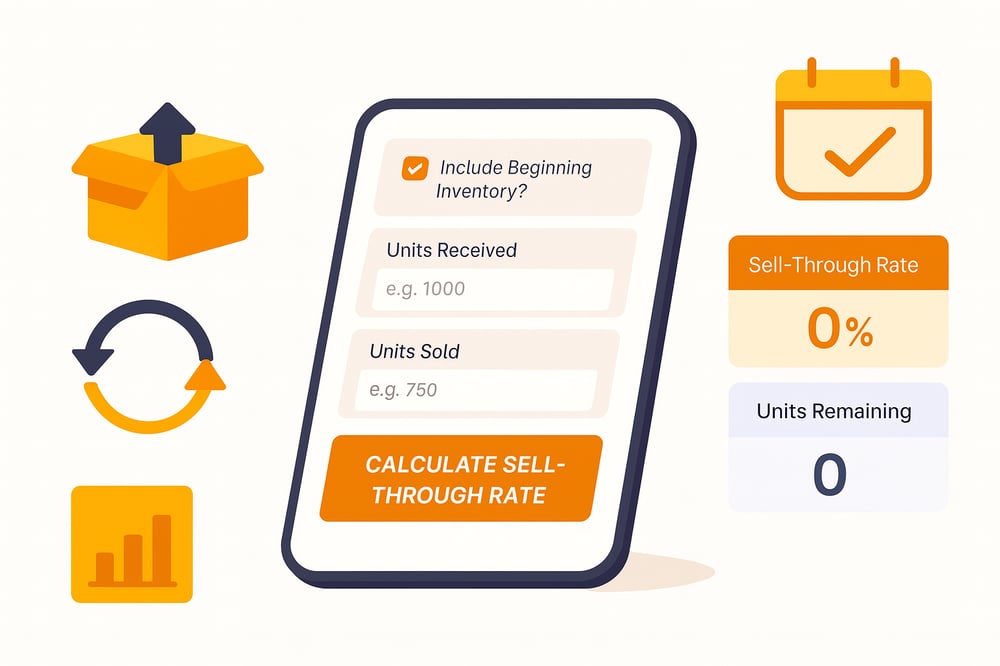
Sell Through Rate = (Units Sold ÷ Units Available) × 100
Our sales through calculator offers two approaches depending on your tracking method:
Standard calculation (without beginning inventory):
- Units Available = Units Received during the period
- Best for: New product launches, drop-ship models, or when tracking only new inventory
Comprehensive calculation (with beginning inventory):
- Units Available = Beginning Inventory + Units Received
- Best for: Ongoing inventory management, warehouse operations, or complete stock analysis
Let’s walk through a practical example. Say you’re analyzing your monthly performance:
- Beginning inventory: 200 units
- Units received: 800 units
- Units sold: 700 units
- Total available: 1,000 units
- Sell-through rate: (700 ÷ 1,000) × 100 = 70%
That 70% tells you that seven out of every ten units available found customers. The remaining 300 units carry forward into next month, which might prompt questions: Is this expected seasonal behavior? Should you adjust reorder quantities? Are promotional efforts needed?
The calculator also shows your remaining units, giving you immediate insight into current stock levels without opening your inventory management system.
Getting the Most from Your Calculations
Using our sell through rate calculator effectively goes beyond just plugging in numbers. Here’s how to extract maximum value from your analysis:
Choose the right time period for your business:
- Weekly tracking works well for fast-moving consumer goods, trending items, or promotional periods
- Monthly analysis suits most retail and e-commerce operations, providing enough data without overwhelming detail
- Quarterly views help with seasonal products, fashion cycles, or strategic planning sessions
- Yearly calculations offer big-picture insights for annual reviews and long-term forecasting
Toggle beginning inventory strategically:
- Include it when you need the complete picture of all available stock performance
- Exclude it when isolating how just the new shipment performed
- Compare both approaches to understand the difference between total inventory health and new stock velocity
Track performance across different dimensions:
- Product categories to identify winners and losers in your catalog
- Suppliers or brands to assess which partnerships deliver the best
- Price points to understand how cost affects movement
- Marketing channels to measure where your sales efforts pay off
Set up a regular calculation rhythm:
- Pick a consistent day each week or month for your analysis
- Compare current performance against previous periods to spot trends
- Document your results to build a historical database
- Share insights with your team so everyone understands inventory dynamics
Remember that context matters tremendously. A 40% sell-through rate might be alarming for everyday basics but perfectly acceptable for specialty items with longer sales cycles. Always interpret your numbers through the lens of your specific business model and industry standards.
Improving Your Sell-Through Performance
Once you understand how to calculate sell through rate and have established your baseline, the real work begins: optimization. Here are proven strategies that move the needle:
Inventory management tactics:
- Right-size your purchase orders based on historical sell-through data rather than gut feelings
- Establish reorder points that maintain stock availability without excessive holding costs
- Create an ABC classification system, prioritizing your fastest movers
- Implement just-in-time ordering for predictable items to free up cash
Sales and marketing levers:
- Bundle slow-moving items with bestsellers to improve overall velocity
- Launch targeted promotions when sell-through rates drop below your threshold
- Adjust pricing strategically; sometimes a small discount dramatically accelerates movement
- Optimize product placement both online and in physical stores based on performance data
Product assortment decisions:
- Phase out consistently poor performers unless they serve a strategic purpose
- Double down on high sell-through items by expanding variants or increasing stock
- Test new products in small quantities until sell-through patterns emerge
- Align your mix with seasonality insights from your historical data
Operational improvements:
- Reduce the time between receiving inventory and making it available for sale
- Improve product photography and descriptions for online inventory to boost conversion
- Train sales teams to actively promote items with declining sell-through rates
- Streamline fulfillment to prevent stockouts of fast-moving items
The formula for the sell through rate gives you the diagnostic tool, but these actions deliver the results. Most successful retailers review their sell-through metrics at least monthly and adjust one or two levers each cycle based on what the data reveals.
Keep Inventory Lean and Profitable With Consistent Tracking
A well-maintained sell-through rhythm turns data into direction. By tracking your sell-through rate regularly, you spot underperforming products early, balance stock levels, and free up cash from slow-moving inventory.
Use the calculator to align purchasing, pricing, and promotions with actual demand, keeping every unit working for your bottom line. When you measure consistently, you manage confidently, and that’s how smart retailers stay lean, agile, and profitable.
Frequently Asked Questions
What is a sell-through rate calculator, and how does it work?
A SLR calculator is a tool that computes the percentage of inventory sold during a specific period. You input units available (or received) and units sold, and it calculates what portion moved to customers. The calculator divides sold units by available units, then multiplies by 100 to give you a percentage showing inventory velocity.
How to calculate sell-through percentage?
Divide the number of units sold by the total units available, then multiply by 100. For example, if you sold 60 units out of 100 available, your sell-through percentage is 60%. You can include beginning inventory in “available” for a complete view or use only units received for new stock analysis.
What is the sell through rate formula for retail inventory?
The formula is: (Units Sold ÷ Total Units Available) × 100. Total available includes beginning inventory plus new receipts if you’re tracking comprehensively, or just new receipts if analyzing only fresh stock. This retail-specific formula helps merchants understand how efficiently they’re converting inventory into sales.
Can I use this sell-through calculator for multiple products?
Yes, though you’ll calculate each product separately. Run individual calculations for each SKU, category, or product line you want to analyze. Many businesses create a spreadsheet tracking sell-through across their catalog, using the calculator to quickly compute each row’s performance. This approach reveals patterns across your assortment.
What is the difference between a sell-through rate calculator and a sale-through calculator?
There’s no functional difference; these terms are used interchangeably in retail and e-commerce. Both calculate the same metric: the percentage of available inventory that sold during a period. Some industries prefer “sell-through” while others say “sale-through,” but the formula and insight remain identical.
Why is it important to calculate the sell-through rate regularly?
Regular calculation reveals inventory trends before they become problems. It identifies slow-moving stock early, validates purchasing decisions, and highlights products needing attention. Monthly tracking helps you spot seasonal patterns, measure promotional impact, and make data-driven decisions about reordering, pricing, and product mix adjustments that directly affect profitability.