Inventory Shrinkage Calculator: Take Control of Stock Loss
Inventory shrinkage quietly drains profits from even the most successful fulfillment operations. Whether running a 3PL business, managing an e-commerce warehouse, or overseeing distribution centers, understanding exactly how much inventory disappears, and what it costs makes the difference between sustainable growth and eroding margins.
Shrinkage is usually a symptom of upstream gaps — receiving accuracy, cycle-count discipline, and SKU visibility. For the full picture on inventory management for online stores, see our pillar guide on the operational habits that keep these numbers in check.
The reality hits hard when physical counts don’t match the books. Products vanish through theft, damage, administrative errors, or supplier fraud.
Each missing item represents lost revenue, wasted storage costs, and diminished customer satisfaction when orders can’t be fulfilled.
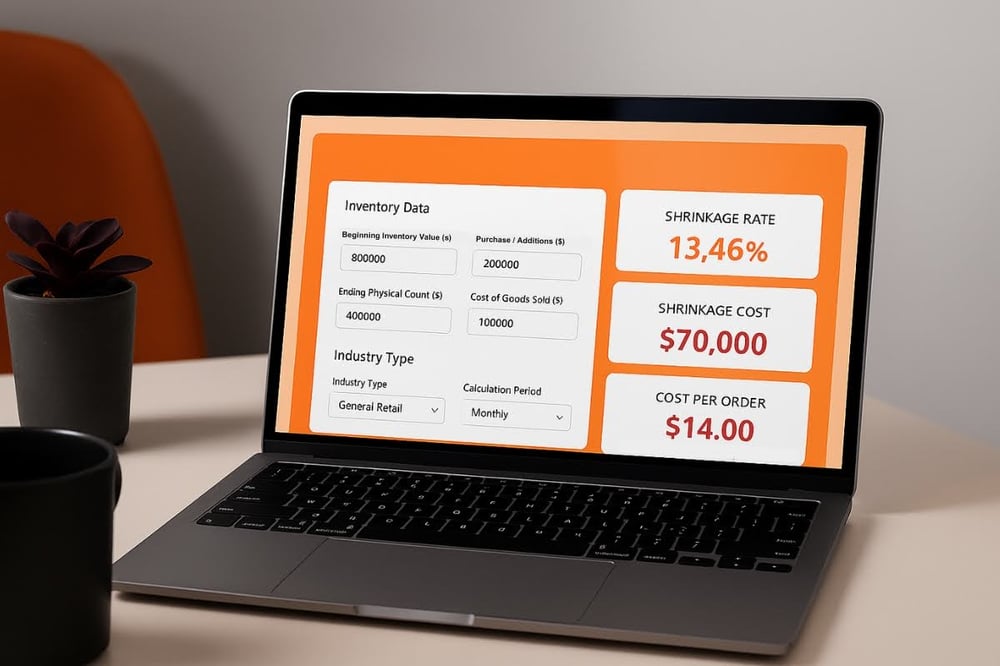
Inventory Shrinkage Calculator
Professional fulfillment edition – Calculate and analyze your inventory losses
Inventory Data
Fulfillment Specifics
Results & Analysis
Making Sense of Your Inventory Shrinkage Calculator Data
The Inventory Shrinkage Calculator does more than show a percentage; it helps you understand where shrinkage is hurting your fulfillment performance. Below are key results you’ll get, along with the inputs that influence each outcome.
Shrinkage Rate (% of Lost Inventory)
This figure tells you what percentage of your inventory went unaccounted for. While 1–2% is common in most industries, anything higher signals a deeper operational issue.
Book Inventory
Includes beginning inventory and purchases. Inaccurate or inflated entries here can distort shrinkage rates.
Physical Count
This is the actual stock counted. Errors in cycle counts or audits directly affect your shrinkage rate accuracy.
Cost Impact Per Order
Shrinkage doesn't just affect totals; it influences how much each fulfilled order truly costs you, especially in 3PL environments where margin control is critical.
Shrinkage Value
The dollar value of lost goods plays a direct role in raising your per-order cost.
Order Volume
Lower order volume with the same shrinkage loss amplifies the per-order financial impact.
Space Efficiency Loss (Cost per Sq. Ft.)
High shrinkage rates in valuable warehouse zones reduce your operational ROI per square foot, meaning you’re paying to store lost value.
Storage Zone Data
Shrinkage in premium or high-turnover zones drives higher cost inefficiency.
SKU Mix
Low-volume or slow-moving SKUs are more prone to loss, and often occupy prime warehouse space unnecessarily.

Key Insights You Can Unlock with the Inventory Shrinkage Calculator
While basic shrinkage rates are useful, the Inventory Shrinkage Calculator offers a starting point for deeper analysis, especially when combined with warehouse and order data. Here are key areas where its results become more actionable.
Warehouse Efficiency Metrics
Once you calculate your shrinkage rate, the next step is understanding where and why those losses are happening inside the warehouse. The calculator helps highlight abnormal patterns that can be connected to more specific metrics:
- Shrinkage by Storage Zone: Use calculator outputs in combination with warehouse zone data to identify loss concentrations. High shrinkage in fast-pick areas vs. long-term storage can signal process issues or insufficient security.
- Velocity-Adjusted Shrinkage: High-volume SKUs often show more shrinkage due to handling frequency. Plug in SKU-specific shrinkage values to assess whether item velocity is driving up your loss rate disproportionately.
- Pick Accuracy Correlation: If shrinkage appears high but physical loss is low, the calculator can help uncover phantom inventory tied to mis-picks, misleading your inventory counts and reorder points.
Financial Impact Analysis
Shrinkage isn’t just a warehouse problem; it affects your bottom line. The calculator’s core output (shrinkage rate and value) can be used to estimate broader financial consequences:
- Carrying Cost Multiplication: Apply the shrinkage value output to your average carrying cost rate to estimate total loss impact. A 2% shrinkage rate on $100K in inventory might translate into $2K in lost goods, but $2.5K+ in total cost once storage, insurance, and labor are included.
- Client Impact in 3PL Settings: Use the calculator to simulate shrinkage at the SKU level, especially for client-owned inventory. Even small loss rates can create stockouts, missed SLAs, and reputational damage, making this an essential tool for 3PL reporting and trust-building.
Using the Inventory Shrinkage Calculator to Guide Prevention Strategies
Preventing inventory shrinkage requires more than locks and cameras. The Inventory Shrinkage Calculator helps quantify the problem, giving teams a data-backed foundation to implement smarter, long-term prevention strategies.
Here’s how calculator insights can directly support advanced loss prevention planning:
Optimize Cycle Counting Based on Shrinkage Trends
If your calculator results show higher-than-expected loss rates, it may signal the need to adjust cycle count frequency. Use shrinkage data to identify which SKUs or zones need more frequent audits.
Strengthen Vendor Compliance from Receiving
Shrinkage often starts at the receiving dock. If calculator results suggest phantom inventory or discrepancies, the issue might be poor vendor accuracy. Integrating shrinkage findings with vendor scorecards can highlight suppliers with frequent errors.
Justify and Prioritize Technology Investments
The calculator also helps determine whether technology upgrades are cost-justified. If shrinkage losses total tens of thousands per year, investing in RFID, barcode systems, or automated audits becomes easier to model and defend.

What a Shrinkage Policy Says About the Fulfillment Standards
Not all shrinkage is created equal, and how your 3PL responds to it reveals a lot about their operational priorities. Some build loss into the contract. Others work to eliminate it.
Here’s a quick look at how fulfillment providers differ in handling inventory loss:
| Aspect | Low-Control 3PL | High-Control 3PL |
| Shrinkage Allowance | 1–3% accepted as standard | Aiming for near-zero loss |
| Inventory Tracking | Periodic spot checks | Real-time SKU-level visibility |
| Resolution Process | Slow, vague, often untracked | Clear escalation and response timeline |
Ask the Right Questions
Don’t assume the logistics has it covered; ask directly about their shrinkage rate, how fast they resolve discrepancies, and whether loss is reimbursed.
- What is your average shrinkage rate across clients?
- How do you track inventory throughout the fulfillment process?
- What systems are in place to detect and prevent loss?
- How quickly do you resolve inventory discrepancies?
- Do you reimburse clients for verified inventory loss?
- How often are cycle counts or audits performed?
- Can I access real-time inventory data at the SKU level?
- How is shrinkage communicated on monthly reports or invoices?
Why “Acceptable Loss” Isn’t Always Acceptable
When shrinkage is built into the contract, you're likely paying for losses that better processes could have prevented. This erodes the margin over time.
Turning Shrinkage Data Into Smarter Fulfillment Decisions
Knowing your shrinkage rate is just the start; real value comes from acting on it. Prioritize high-dollar loss SKUs over high-percentage loss rates, and implement changes in stages. Start with process improvements and training before investing in complex security upgrades.
Looking to improve more than just inventory accuracy? Fulfyld will help you scale efficiently while reducing risk through better systems, visibility, and support.
Let’s turn shrinkage data into a fulfillment strategy, together.