Did you know that over 67% of logistics leaders now use advanced 3PL analytics to boost operational speed, lower cost-per-order, and improve inventory accuracy?
As ecommerce volume grows, brands increasingly rely on precise, data-driven insights to identify bottlenecks and optimize warehouse and transportation performance across the supply chain.
Below, we break down the technical foundations behind modern analytics, the metrics that matter most, and how brands can use data to drive measurable performance improvements.
Main Benefits Highlighting the Strength of 3PL Data Analytics in Modern Logistics
The logistics ecosystem includes countless moving parts, from inventory levels to carrier performance. With logistic analytics and business intelligence, brands unify these data points into one operational view, enabling faster diagnosis and proactive action before issues escalate.
Real-Time Operational Visibility
A key benefit of analytics-enabled operations is constant visibility into warehouse and order flows. Rather than relying on end-of-day summaries, teams can monitor:
- Receiving lag times, identifying SKU-level delays from inbound carriers
- Picking productivity heatmaps, displaying which zones or pick paths create congestion
- Order queue velocity, showing how quickly orders progress through each workflow stage
This allows brands to detect inefficiencies, such as slow-moving aisles or underperforming pick stations, before they affect customer delivery SLAs.
Root-Cause Identification for Fulfillment Errors
Technical analytics tools provide detailed error attribution. Instead of reviewing incomplete reports, brands can access:
- SKU-level mispick frequencies
- Workstation-level packing error rates
- Shift-by-shift accuracy deviations
With root-cause visibility, operational teams can implement targeted corrections such as revising slotting layouts, retraining packers, or adjusting workstation ergonomics.
Performance Benchmarking Across Warehouses, Shifts, and Carriers
As brands scale, variance among facilities or carriers becomes more complex. Analytics create standardized benchmarks across:
- Distribution nodes
- Peak vs. non-peak staffing shifts
- Carrier performance by zone and service type
This helps determine which warehouse layout performs best, which workers or shifts need support, and which carriers consistently fall short on transit commitments.
How Brands Use 3PL Business Intelligence to Improve Operations
Modern fulfillment environments generate massive datasets, from barcode scans to carrier scans, SKU slotting, labor time stamps, and inventory movements. When aggregated, these datasets uncover precise optimization opportunities.
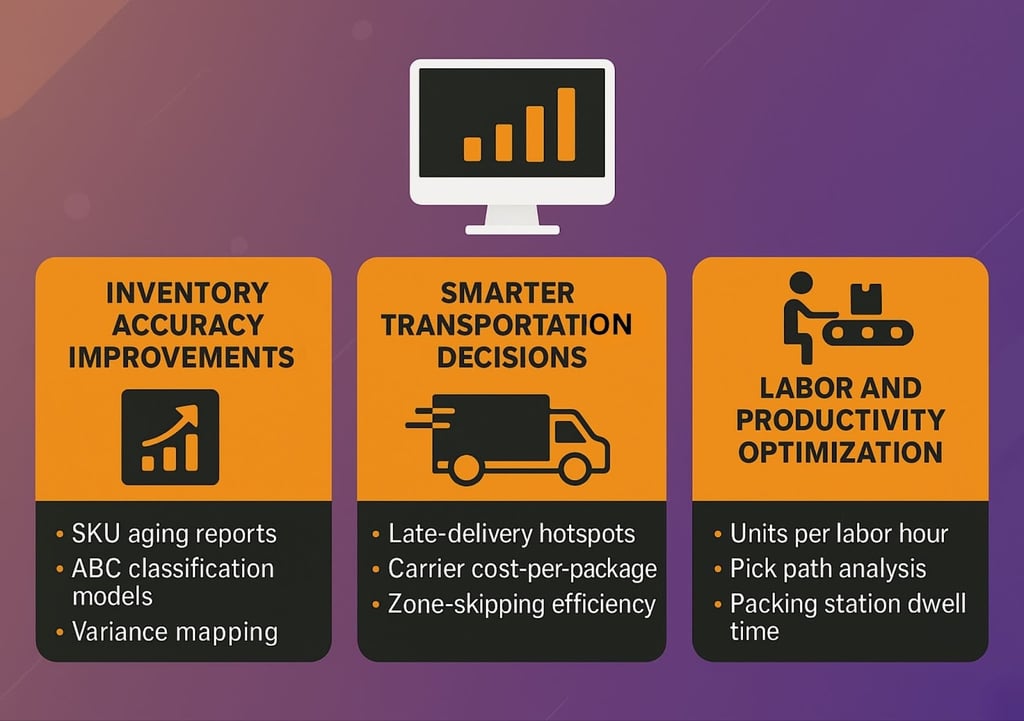
Inventory Accuracy Improvements from Order Fulfillment Data Analysis
Order fulfillment data reveals discrepancies that traditional cycle counting often misses. Data-rich 3PL environments use:
- SKU aging reports to detect dead stock or obsolete inventory
- ABC classification models to reassign high-velocity SKUs to optimal pick zones
- Variance mapping to show which SKUs frequently mismatch WMS counts
By analyzing this data, brands can reduce shrinkage, lower safety stock, and achieve more reliable forecasting.
Smarter Transportation Decisions Using Carrier-Level Performance Analytics
Carrier performance varies dramatically by lane, region, and season. Analytics systems compare performance metrics across thousands of shipments:
- Late-delivery hotspots by ZIP prefix
- Carrier cost-per-package vs. SLA performance
- Zone-skipping efficiency based on order density
These insights allow brands to reassign carriers for underperforming lanes, negotiate better rates, and improve last-mile reliability.
Labor and Productivity Optimization Inside the Warehouse
Labor is one of the highest cost centers in fulfillment. Analytics highlight:
- Units per labor hour (UPLH) by picker or workstation
- Pick a path to waste travel distance
- Packing station dwell time patterns
With granular workforce data, 3PLs can redesign workflows, rebalance labor, and configure automation more effectively.
3PL Key Metrics That Define Effective Analytics
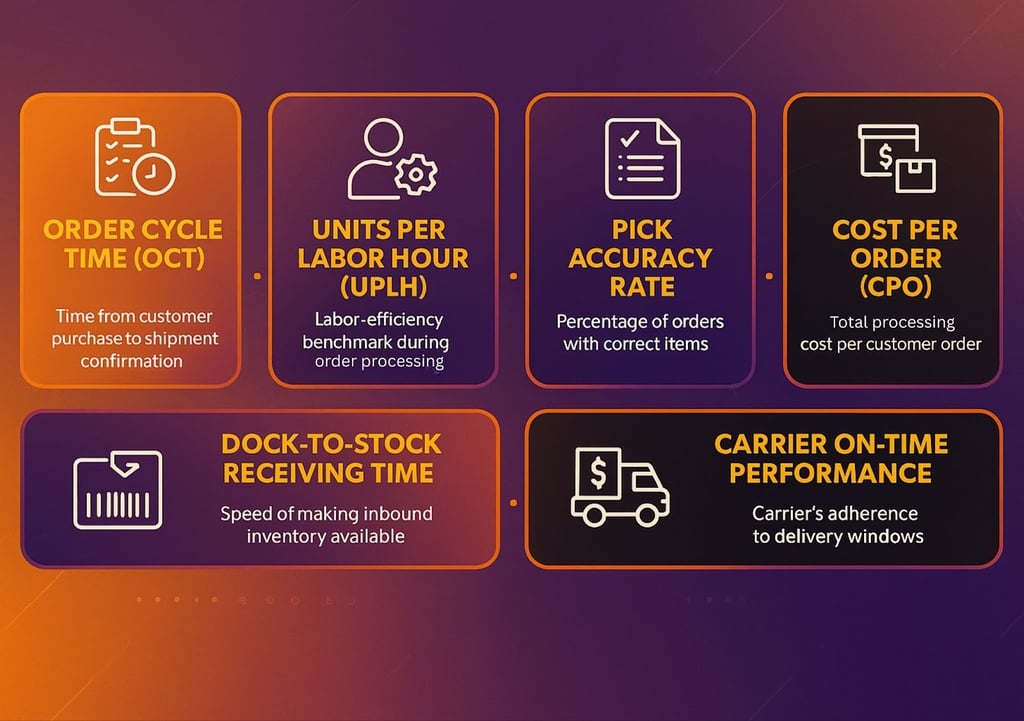
Technical logistics optimization depends on the consistent measurement of operational KPIs. The most important include:
Order Cycle Time (OCT)
Time from customer purchase to shipment confirmation. Lower OCT indicates streamlined picking, packing, and processing flows.
Units Per Labor Hour (UPLH)
A labor-efficiency benchmark showing how effectively human resources are utilized during picking, packing, and receiving.
Pick Accuracy Rate
Percentage of orders with correct items. Highly accurate pick rates reduce returns, reships, and inventory disruptions.
Dock-to-Stock Receiving Time
Measures how quickly inbound inventory becomes available for order allocation.
Cost Per Order (CPO)
A critical financial measure reflecting labor, packaging, storage, shipping, and overhead blended into a per-order metric.
Carrier On-Time Performance
Tracks whether carriers hit their expected delivery windows at ZIP-code and service-type granularity.
When a Brand Should Invest in 3PL Data Analytics?
Investing in analytics becomes necessary when operational complexity reaches a threshold where intuition no longer works. Brands typically need 3PL intelligence when:
- Order volumes exceed 2,000 orders per week, making manual tracking unreliable
- Inventory accuracy drops below 95%, signaling systemic process gaps
- Multi-warehouse fulfillment introduces allocation complexity
- Cost per order increases without a clear cause
- Seasonal fluctuations make forecasting difficult
- Carrier performance variance creates unpredictable delivery times
At this stage, analytics becomes not just an advantage but a requirement.
Building a Data-Driven Partnership With a Logistics Provider
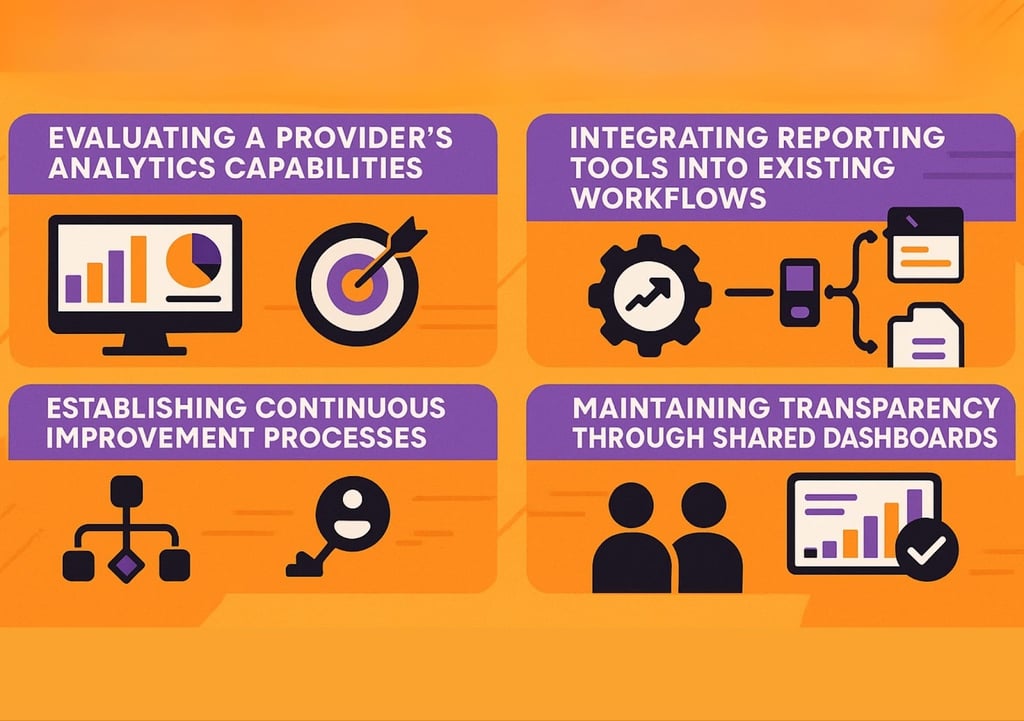
A strong relationship with a company depends on transparency, alignment, and shared access to meaningful data. Establishing this foundation enhances collaboration and long-term operational value.
Evaluating a Provider’s Analytics Capabilities
Understanding a provider’s analytics strengths ensures you partner with a company that supports scalable, insight-driven growth.
- Systems should include advanced reporting dashboards.
- Data must be accurate through real-time tracking tools.
- Analytics teams provide value with specialized expertise.
Aligning Metrics With Business Goals
Metrics only matter when they support your objectives. Aligning them creates synergy between operational needs and analytics-driven improvements.
- KPIs reflect goals using custom-aligned benchmarks.
- Department strategies unite through shared data priorities.
- Growth becomes measurable with goal-specific indicators.
Integrating Reporting Tools Into Existing Workflows
Smooth analytics integration ensures your team can access data quickly and use it effectively. Workflows improve when teams rely on centralized reporting portals that organize critical logistics data in one place.
Daily operations stay aligned through automated snapshots that keep everyone informed, while task efficiency increases thanks to simplified data visibility that removes guesswork and supports faster decision-making.
Establishing Continuous Improvement Processes
Ongoing refinement ensures your supply chain evolves. Analytics highlight where improvements can drive measurable gains.
- Performance rises through routine metric evaluations.
- Inefficiencies shrink with ongoing data-driven tweaks.
- Success becomes sustainable through long-term optimization.
Maintaining Transparency Through Shared Dashboards
Shared dashboards ensure both the business and logistics partner operate from the same information. Transparency strengthens communication and turns data into actionable improvements.
- Issues are resolved faster using shared performance snapshots.
- Collaboration improves through uniform data access.
- Reporting consistency enhances operational alignment.
Overcoming Implementation Challenges
Integrating analytics is not without its technical obstacles. Most challenges stem from fragmented data, inconsistent reporting structures, and legacy systems.
Fixing Fragmented Data Across WMS, TMS, and Ecommerce Platforms
Brands often use multiple systems (Shopify, ERP, WMS, TMS). Without synchronization, datasets become siloed.
3PLs address this by:
- Establishing API-based data flows
- Building common data models for consistent attribution
- Using ETL (Extract, Transform, Load) pipelines to standardize multiple data sources
Ensuring Data Cleanliness
Analytics are only useful when the data is clean. Technical accuracy requires:
- SKU master data validation
- Inventory reconciliation scripts
- Regular deduplication and data governance routines
Clean data ensures predictive modeling and reporting accuracy.
Choosing Analytics Tools With Warehouse-Friendly Integrations
Best-in-class analytics platforms integrate directly with barcode systems, scanners, and automation hardware.
Key features include:
- Warehouse sensor connectivity
- Real-time event tracking
- Cross-platform dashboard synchronization
Actionable Ways to Put 3PL Analytics to Work
Modern supply chains demand more than manual reporting; they require analytical precision. With advanced visibility into order behavior, warehouse productivity, and carrier performance, brands can optimize fulfillment operations with clarity and confidence.
3PL analytics transform raw operational data into reliable, measurable logistics insights, giving companies the competitive advantage needed to scale effectively.