Customer Retention Rate Calculator: Take Control of Your Churn With One Quick Calculation
Struggling to see if your customers are sticking around or slipping away? Our Customer Retention Rate Calculator gives you instant clarity on how well you’re keeping the customers you’ve worked so hard to acquire.
Whether you’re refining your customer experience, evaluating loyalty strategies, or presenting key metrics to stakeholders, this tool helps you measure retention with precision, fast, accurately, and easy to use.
Use it now to uncover trends, reduce churn, and build stronger, longer-lasting customer relationships that fuel sustainable growth.
Analyzing Every Component of the Customer Retention Rate Calculator + Real-World Examples
Here’s a detailed examination of each element in the Customer Retention Rate Calculator, featuring practical examples and business scenarios to help you understand how this tool impacts your customer loyalty analysis and retention strategy development.
1. Time Period Selection
This selector allows you to define the measurement timeframe for your retention analysis, enabling consistent tracking across monthly, quarterly, or yearly business cycles.
Examples:
Monthly Analysis – E-commerce Subscription:
- Period: Monthly tracking
- Use Case: SaaS platform monitoring churn
- Frequency: Real-time retention monitoring
Quarterly Review – B2B Services:
- Period: Quarterly assessment
- Use Case: Professional services firm
- Strategy: Contract renewal analysis
Yearly Evaluation – Enterprise Solutions:
- Period: Annual retention measurement
- Use Case: Enterprise software provider
- Focus: Long-term relationship tracking
Why It Matters: Period selection ensures your retention metrics align with business cycles and enables meaningful comparisons across consistent timeframes for strategic planning.
2. Customers at Start of Period Input
This field captures your customer base size at the beginning of your measurement period, establishing the foundation for calculating retention performance across your business operations.
Examples:
Growing SaaS Company:
- Starting Customers: 2,500
- Business Stage: Scale-up phase
- Customer Type: Monthly subscribers
Established E-commerce Brand:
- Starting Customers: 15,000
- Business Model: Repeat purchase focus
- Market Position: Mature brand
Local Service Business:
- Starting Customers: 450
- Service Type: Professional consulting
- Geographic Scope: Regional market
Why It Matters: Starting customer count provides the baseline for measuring retention effectiveness and reveals the scale of your customer relationship management challenges.
3. New Customers Acquired Input
This component tracks customers gained during your measurement period, separating growth from retention to ensure accurate loyalty measurement and prevent inflated retention calculations.
Examples:
High-Growth Startup:
- New Customers: 800 monthly
- Acquisition: Aggressive marketing campaigns
- Growth Rate: 32% monthly expansion
Stable Enterprise Business:
- New Customers: 125 quarterly
- Strategy: Referral-based growth
- Focus: Quality over quantity
Seasonal Retail Business:
- New Customers: 2,200 (holiday quarter)
- Channels: Social media advertising
- Pattern: Seasonal acquisition spikes
Why It Matters: New customer tracking ensures retention calculations focus purely on existing customer loyalty rather than being skewed by acquisition performance.
4. Customers at End of Period Input
This field captures your total customer count at the measurement period’s conclusion, representing the combined result of retention efforts and customer acquisition activities.
Examples:
Subscription Box Service:
- Ending Customers: 2,850
- Retention Strategy: Personalization focus
- Churn Mitigation: Pause options offered
Professional Services Firm:
- Ending Customers: 14,200
- Service Quality: High-touch client management
- Retention Tools: Regular check-ins
Mobile App Platform:
- Ending Customers: 425
- Challenge: Competitive market
- Response: Feature enhancement focus
Why It Matters: End-period customer count reveals the net result of your retention strategies and provides insight into overall business health and customer satisfaction levels.
5. Calculate CRR Button
This triggers the instant computation of your customer retention metrics using the industry-standard formula for loyalty measurement and business performance analysis.
Calculation Process:
- Applies CRR formula: ((E – N) / S) × 100%
- Validates input data accuracy
- Provides immediate strategic insights
Why It Matters: Real-time calculation enables quick strategic decisions for customer success initiatives, retention program adjustments, and resource allocation planning.
6. Customer Retention Rate Display
The calculator shows your retention percentage with contextual analysis based on industry benchmarks and customer loyalty performance standards.
Example Results and Interpretations:
Excellent Retention (85%+ CRR):
- Scenario: Premium software platform
- Start: 1,000, New: 150, End: 980
- Interpretation: Outstanding customer satisfaction with strong product-market fit
Good Retention (70-85% CRR):
- Scenario: E-commerce marketplace
- Start: 5,000, New: 800, End: 4,650
- Interpretation: Solid customer relationships with optimization opportunities
Average Retention (50-70% CRR):
- Scenario: Mobile gaming app
- Start: 10,000, New: 2,000, End: 8,500
- Interpretation: Competitive pressure requires strategic attention
Poor Retention (Below 50% CRR):
- Scenario: Generic consumer product
- Start: 2,000, New: 400, End: 1,200
- Interpretation: Urgent need for customer experience improvements
7. Performance Interpretation Guidance
The calculator provides strategic recommendations based on your calculated retention rate compared to industry standards and customer success best practices.
Status Categories:
“Excellent retention! Outstanding customer loyalty”
- Indicates exceptional customer satisfaction
- Strong competitive positioning
- Premium value delivery success
“Good retention rate – solid customer relationships”
- Represents healthy business fundamentals
- Sustainable customer base
- Growth-ready foundation
“Average retention – room for improvement”
- Suggests strategic attention is needed
- Customer experience optimization is required
- Competitive vulnerability exists
“Low retention rate – requires immediate attention”
- Urgent customer success intervention needed
- Fundamental value proposition review
- Churn reduction strategy is essential
8. Copy Result Functionality
This feature enables easy sharing and documentation of retention metrics for stakeholder communications and strategic planning purposes.
Examples:
Executive Reporting:
- Format: “Customer Retention Rate (Quarterly): 78.5%”
- Use: Board presentations and investor updates
- Context: Performance tracking documentation
Team Communications:
- Application: Customer success team alignment
- Purpose: Goal setting and performance monitoring
- Integration: CRM and analytics platforms
Why It Matters: Easy data sharing facilitates organization-wide retention focus and enables consistent metric tracking across departments and reporting periods.
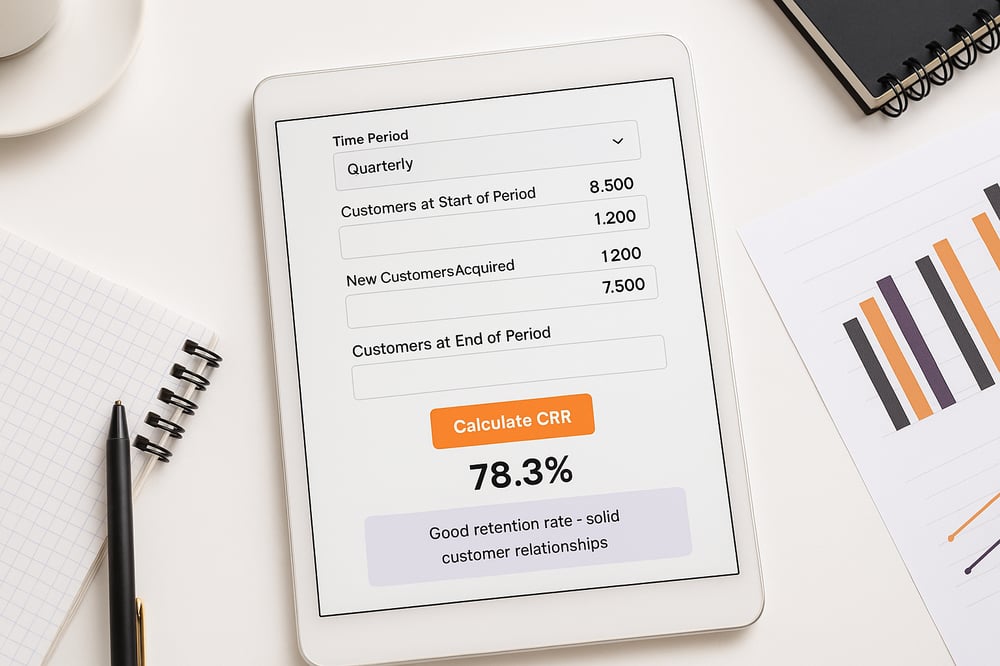
Complete Retention Analysis Example
Scenario: Direct-to-Consumer Fitness App
Input Values:
- Period: Quarterly analysis
- Starting Customers: 8,500 (subscription base)
- New Customers: 1,200 (marketing campaign results)
- Ending Customers: 7,800 (post-churn count)
Business Context:
- Product: Fitness tracking and workout app
- Pricing: $12.99 monthly subscription
- Competition: High with free alternatives
- Target: Health-conscious consumers 25-45
Calculation Results:
- CRR: 78.3%
- Status: Good retention rate – solid customer relationships
- Interpretation: Healthy loyalty with optimization potential
Strategic Analysis:
- Above-average retention for the competitive fitness app market
- Strong core product value demonstrated by customer loyalty
- Opportunity for improvement through enhanced user engagement
- Solid foundation for sustainable subscription business growth
Understanding these calculator components empowers business leaders and customer success professionals to make data-driven decisions about retention strategies, customer experience investments, and long-term business sustainability while ensuring accurate performance measurement for stakeholder communications and strategic planning.
Turn Insights Into Action: What to Do After Calculating Your CRR
Your customer retention rate is more than just a number – it’s your roadmap to sustainable revenue growth. The difference between successful businesses and struggling ones isn’t just knowing their CRR, but taking immediate action based on those insights.

Spot Early Churn Signals Before It’s Too Late
Don’t wait for customers to cancel – identify warning signs weeks before they even consider leaving. Smart businesses use predictive indicators to intervene early and save valuable customer relationships.
Key warning signals to monitor:
- Login frequency drops by 40% or more
- Support ticket volume increases significantly
- Feature usage declines over 30 days
- Payment delays or billing inquiries spike
- Email engagement rates plummet
Pro Tip: Create a customer health score combining these metrics. When scores drop below 70%, trigger automated retention campaigns with personalized offers or check-in calls.
Optimize Your Customer Journey for Maximum Retention
Every touchpoint matters in your customer’s experience. Small friction points compound over time and eventually drive customers away, even when they love your core product.
Critical optimization areas:
- Streamline onboarding to achieve first value within 7 days
- Eliminate unnecessary steps in billing processes
- Provide self-service options for common issues
- Create clear escalation paths for complex problems
- Implement proactive communication for service updates
Pro Tip: Map your customer journey and identify the top 3 friction points causing the most complaints. Fix these first for immediate retention improvements.
Build Data-Driven Retention Warning Systems
Automated alerts prevent retention disasters before they impact your bottom line. Set up monitoring systems that flag concerning trends and enable proactive intervention strategies.
Essential monitoring metrics:
- Segment-specific retention rate changes
- Unusual churn spikes by acquisition channel
- Geographic or demographic retention variations
- Product feature adoption decline patterns
- Customer satisfaction score drops
Pro Tip: Create weekly retention dashboards for your team. When metrics deviate from normal ranges by 15% or more, investigate immediately and implement corrective actions.
Troubleshooting Low Retention Rates Like a Pro
Even great products can suffer from hidden retention destroyers that slowly erode customer loyalty. Identifying and eliminating these business-killing issues is crucial for long-term success and competitive positioning.

Product-Market Fit Misalignment Issues
When customers initially buy but quickly leave, your product might not solve their real problems. This creates inevitable churn regardless of your marketing efforts or customer service quality.
Common misalignment symptoms:
- High initial sales but rapid churn within 90 days
- Customers using only basic features before leaving
- Frequent requests for features you don’t offer
- Low Net Promoter Scores despite good support
- Competitors winning customers with “lesser” products
The Fix: Survey churned customers within 48 hours of cancellation. Ask specifically what outcome they expected versus what they experienced. Use these insights to refine your value proposition and marketing messaging.
Pricing Strategy Problems That Drive Churn
Pricing misalignment kills retention faster than almost any other factor. Customers who feel overcharged will actively seek alternatives, while underpricing attracts disloyal, price-sensitive buyers.
Pricing red flags to watch:
- Higher churn rates in specific pricing tiers
- Customers downgrading before canceling completely
- Frequent price objections during sales calls
- Low retention among discount or promotional customers
- Competitors winning on price alone
The Solution: Implement value-based pricing tied to customer success metrics. Offer pricing tiers that scale with results achieved, not arbitrary feature restrictions.
Customer Experience Gaps That Frustrate Users
Small frustrations accumulate into major retention problems over time. Even customers who love your core product will leave if ongoing interactions are consistently difficult or time-consuming.
Experience gap indicators:
- Support tickets about the same issues repeatedly
- Long resolution times for simple requests
- Customers expressing frustration in feedback
- High abandonment rates in key processes
- Negative reviews mentioning “difficult to use”
The Fix: Conduct monthly customer experience audits. Record actual customer interactions and identify the top 3 most common frustration points. Eliminate these systematically, starting with the easiest fixes first.
Competitive Pressure Response Failures
In competitive markets, retention requires continuous value demonstration beyond your initial offering. Customers constantly evaluate alternatives, and retention depends on staying ahead of emerging competitive threats.
Competitive vulnerability signs:
- Customers mentioning competitor features during support calls
- Increased churn after competitor product launches
- Price comparison requests are becoming more frequent
- Feature requests matching competitor offerings
- Customers asking about contract flexibility
The Solution: Create a competitive intelligence system that monitors rival activities monthly. Develop retention campaigns highlighting your unique advantages and introducing new value propositions that strengthen customer lock-in.
Make Retention the Metric That Powers Your Growth
Customer retention isn’t just a number; it’s a signal of your brand’s long-term health. With our Customer Retention Rate Calculator, you’ve uncovered where you stand. Now it’s time to act. Use these insights to optimize your customer experience, reduce churn, and build lasting loyalty.
Whether you’re a DTC brand or scaling with a 3PL like Fulfyld, retention is your most reliable growth engine. Start tracking smarter, acting faster, and turning repeat buyers into lifetime customers.