ROAS Calculator: Track, Analyze, and Improve Every Marketing Dollar
Struggling to understand if your ad spend is actually paying off? Our ROAS Calculator helps you instantly measure the return on every dollar you invest in advertising.
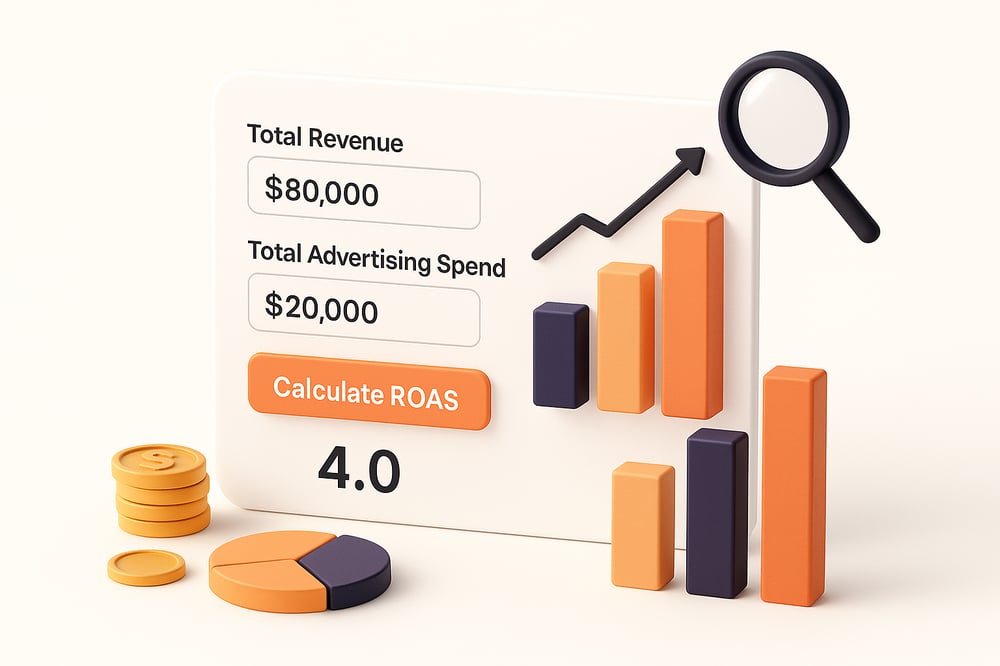
Whether you’re optimizing a campaign, comparing marketing channels, or planning your next ad budget, this tool shows you exactly how much revenue you’re generating per dollar spent – quick, clear, and precise.
Use it now to maximize ad performance, eliminate guesswork, and drive smarter, more profitable marketing decisions.
Understanding Each Element of the ROAS Calculator + Practical Examples
Here’s a comprehensive breakdown of each component in the ROAS Calculator, complete with practical examples and advertising scenarios to help you understand how this tool impacts your marketing performance analysis and advertising investment decisions.
1. Total Revenue Generated Input
This field captures your complete sales income directly attributed to your advertising campaigns, representing the financial return from your marketing investments across all channels.
Examples:
E-commerce Fashion Campaign:
- Revenue: $125,000 monthly
- Google Ads + Facebook campaign
- Average order value: $89
B2B Lead Generation:
- Revenue: $380,000 quarterly
- LinkedIn advertising focus
- High-value client acquisition
Local Service Business:
- Revenue: $45,000 monthly
- Google Ads + Facebook local campaigns
- Service-based revenue model
Why It Matters: Total revenue attribution determines the actual monetary impact of your advertising efforts and validates your marketing channel effectiveness.
2. Total Advertising Spend Input
This component captures all direct costs invested in your advertising campaigns, including platform fees, creative development, and campaign management expenses across all marketing channels.
Examples:
Multi-Platform E-commerce Campaign:
- Ad Spend: $28,000 on $125,000 revenue
- Platforms: Google Ads, Facebook, Instagram
- Includes: Ad spend, creative costs, management fees
SaaS Customer Acquisition:
- Ad Spend: $95,000 on $380,000 revenue
- Focus: LinkedIn, Google, industry publications
- High customer lifetime value strategy
Local Business Marketing:
- Ad Spend: $12,000 on $45,000 revenue
- Google Ads and Facebook local campaigns
- Geographic targeting approach
Why It Matters: Total ad spend determines your marketing efficiency and reveals the true cost of customer acquisition across your advertising portfolio.
3. Calculate ROAS Button
This triggers the instant computation of your advertising return metrics using the standard industry formula for marketing performance analysis.
Calculation Process:
- Computes ROAS ratio (Revenue ÷ Ad Spend)
- Calculates percentage return
- Provides real-time campaign insights
Why It Matters: Immediate calculation enables quick strategic decisions for budget reallocation, campaign optimization, and marketing investment planning.
4. ROAS Value Display
The calculator shows your advertising return ratio with contextual analysis based on industry benchmarks and campaign performance standards.
Example Results and Interpretations:
Excellent Performance (4.0x+ ROAS):
- Scenario: Established e-commerce brand
- Revenue: $200,000, Ad Spend: $45,000
- Interpretation: Outstanding efficiency with strong brand recognition
Good Performance (2.0-4.0x ROAS):
- Scenario: Growing SaaS company
- Revenue: $150,000, Ad Spend: $60,000
- Interpretation: Profitable campaigns supporting sustainable growth
Break-even Performance (1.0-2.0x ROAS):
- Scenario: New product launch
- Revenue: $80,000, Ad Spend: $65,000
- Interpretation: Baseline profitability with optimization potential
Poor Performance (Below 1.0x ROAS):
- Scenario: Untargeted mass campaign
- Revenue: $35,000, Ad Spend: $50,000
- Interpretation: Immediate optimization required for viability
5. Performance Status Guidance
The calculator provides strategic recommendations based on your calculated ROAS compared to industry standards and advertising best practices.
Status Categories:
“Excellent Performance – Outstanding ROAS”
- Indicates exceptional campaign efficiency
- Strong audience targeting success
- Premium value proposition delivery
“Good Performance – Profitable Campaign”
- Represents solid advertising fundamentals
- Healthy return on investment
- Sustainable growth potential
“Break-even – Consider Optimizing”
- Suggests immediate attention is needed
- Campaign refinement opportunities
- Targeting and creative review required
“Poor Performance – Campaign Needs Improvement”
- Requires urgent optimization
- Fundamental strategy reassessment
- Cost structure evaluation is needed
6. Revenue and Ad Spend Breakdown Display
This shows the absolute values of your campaign investment and returns, providing clear visibility into your advertising economics.
Examples:
High-Performance Campaign:
- Revenue: $180,000, Ad Spend: $40,000
- ROAS: 4.5x (450% return)
- Exceptional efficiency for scale-up
Moderate Campaign:
- Revenue: $95,000, Ad Spend: $38,000
- ROAS: 2.5x (250% return)
- Solid profitability with optimization room
Why It Matters: The breakdown reveals the actual cash flow impact of your advertising investments and guides budget allocation decisions.
Complete Campaign Analysis Example
Scenario: Direct-to-Consumer Skincare Brand
Input Values:
- Revenue: $320,000 (quarterly campaign results)
- Ad Spend: $80,000 (Facebook, Google, influencer partnerships)
- Business Model: Premium skincare products
Campaign Details:
- Target: Women 25-45, skincare enthusiasts
- Creative: Video testimonials + product education
- Channels: Facebook Ads (60%), Google Ads (30%), Influencer partnerships (10%)
Calculation Results:
- ROAS: 4.0x
- Return Percentage: 400%
- Status: Excellent Performance – Outstanding ROAS
Analysis:
- Outstanding performance indicating strong product-market fit
- Effective audience targeting and creative messaging
- Premium pricing is supported by customer value perception
- Excellent foundation for budget scaling and expansion
Strategic Recommendations:
- Increase budget allocation to the highest-performing ad sets
- Expand successful creative formats across additional platforms
- Test lookalike audiences based on high-value customers
- Implement retargeting campaigns for cart abandoners
Understanding these calculator components helps marketing professionals and business owners make informed decisions about campaign optimization, budget allocation, and advertising strategy while ensuring accurate performance measurement for sustainable growth and stakeholder communications.
Proven Tactics That Skyrocket Your ROAS Performance
Transform your advertising performance with these battle-tested strategies that consistently deliver exceptional returns. Each tactic addresses critical performance bottlenecks that drain your budget.

Master Laser-Focused Audience Targeting
Stop wasting money on audiences that will never convert. Precision targeting is the foundation of exceptional ROAS performance.
Key Actions:
- Analyze your top 20% customers and create detailed buyer personas
- Build lookalike audiences based on your highest-value purchasers
- Use progressive audience narrowing – start broad, then refine based on data
- Remove underperforming demographics that drain the budget without results
Pro Tip: Use the 70/30 rule – 70% proven audiences, 30% testing new segments. This balance maintains performance while discovering new opportunities.
Deploy Scientific Creative Testing
Your ad creative determines whether people stop scrolling or keep scrolling. Systematic testing removes guesswork from creative optimization.
Testing Framework:
- Implement the 70/20/10 budget split (proven/variations/new concepts)
- Test one element at a time: headlines, images, CTAs, or video thumbnails
- Create angle-based variations: problem-focused, benefit-focused, social proof
- Run minimum 3-day tests with statistical significance thresholds
Pro Tip: Winner takes all – once you identify a winning creative, scale it aggressively while continuing to test new concepts in smaller budgets.
Create Conversion-Optimized Landing Pages
Perfect ads with poor landing pages equal wasted money. Your landing page must seamlessly continue the conversation started in your advertisement.
Optimization Checklist:
- Ensure the message matches between the ad copy and the landing page headline
- Load time under 3 seconds (use Google PageSpeed Insights)
- Single conversion focus – remove navigation and distractions
- Include trust signals: testimonials, security badges, guarantees
Pro Tip: Test your mobile experience first – 70% of ad traffic comes from mobile devices. Desktop optimization comes second.
Implement Smart Bidding Strategies
Let data and algorithms drive bidding decisions, not emotions. Modern automated bidding processes thousands of signals that manual bidding cannot match.
Bidding Best Practices:
- Start with Target ROAS or Maximize Conversion Value
- Allow 2-4 week learning periods before making adjustments
- Adjust bid modifiers for high-converting times, devices, and locations
- Increase bids when ROAS exceeds targets to capture more volume
Pro Tip: Set realistic ROAS targets – too aggressive targets limit ad delivery. Start conservative, then optimize upward.
Structure Campaigns for Success
Poor campaign organization unknowingly sabotages results. Strategic campaign architecture unlocks better performance and easier optimization.
Structure Framework:
- Separate campaigns by customer intent: cold, warm, hot audiences
- Create single-objective campaigns (avoid multiple goals per campaign)
- Organize by product categories, geographic markets, or customer segments
- Use clear naming conventions for easy performance tracking
Pro Tip: Start with 3 core campaigns maximum, then expand. Too many campaigns split budgets and prevent algorithm learning.
Silent ROAS Killers Destroying Your Ad Performance
These hidden performance destroyers lurk in campaigns, silently draining budgets while delivering disappointing results. Identify and eliminate them immediately.

Targeting Everyone (And Converting No One)
Broad targeting wastes the budget by showing ads to people who will never buy. Precision beats volume every time in advertising.
Warning Signs:
- High impressions but low click-through rates
- Lots of clicks but few conversions
- Cost per acquisition is increasing over time
- Low relevance scores or quality ratings
The Fix: Implement layered targeting combining demographics, interests, and behaviors. Replace “women interested in fitness” with “women aged 25-40 interested in yoga who purchased health products online.”
Boring Ads That Get Ignored
Generic, uninspiring ads blend into newsfeeds and waste money. Scroll-stopping creative is non-negotiable for ROAS success.
Red Flags:
- Declining engagement rates over time
- High cost per click with low conversion rates
- Ad fatigue occurs within 3-5 days
- Using stock photos instead of authentic content
The Fix: Create bold, authentic visuals with compelling headlines. Use real customer photos, incorporate urgency elements, and test video content that generates 2-3x higher engagement.
Landing Pages That Kill Conversions
Even perfect ads fail with broken landing pages. A seamless user experience from ad to conversion is crucial for ROAS.
Problem Indicators:
- High click-through rates but low conversion rates
- Bounce rates above 70%
- Page load times over 3 seconds
- Mobile experience issues
The Fix: Ensure the message matches between ads and landing pages. Remove navigation distractions, focus on single conversion goals, and optimize for a mobile-first experience.
Wrong Campaign Objectives Confuse Algorithms
Misaligned objectives prevent algorithms from optimizing effectively. Clear direction produces better results than confused signals.
Common Mistakes:
- Using traffic objectives when you want sales
- Choosing engagement for lead generation campaigns
- Mixing multiple objectives in a single campaign
- Not allowing sufficient learning periods
The Fix: Align campaign objectives with true business goals. Want sales? Choose conversion objectives. Need leads? Select lead generation. Give algorithms clear success signals.
Budget Spread Too Thin Across Campaigns
Insufficient budgets prevent effective algorithm learning and optimization. Concentrated budget outperforms scattered spending.
Budget Killers:
- Too many campaigns with small daily budgets
- Equal budget distribution regardless of performance
- Constantly pausing and restarting campaigns
- Not following the 80/20 budget allocation rule
The Fix: Consolidate underperforming campaigns and allocate a minimum $50-100 daily budget per campaign. Put 80% of the budget into the best performers, 20% into testing new opportunities.
Fuel Smarter Growth With Real-Time ROAS Insights
Knowing exactly how your ad dollars perform is the edge modern marketers need. With our ROAS Calculator, you gain instant visibility into campaign effectiveness and real-time ROI. From sharpening your targeting to refining creatives and budget strategies, this tool equips you to make confident, data-driven decisions.
Don’t just advertise – optimize every dollar for maximum impact. Use the calculator now to cut waste, improve performance, and scale smarter.