• Retail: 20-50%
• eCommerce: 40-60%
• Services: 50-80%
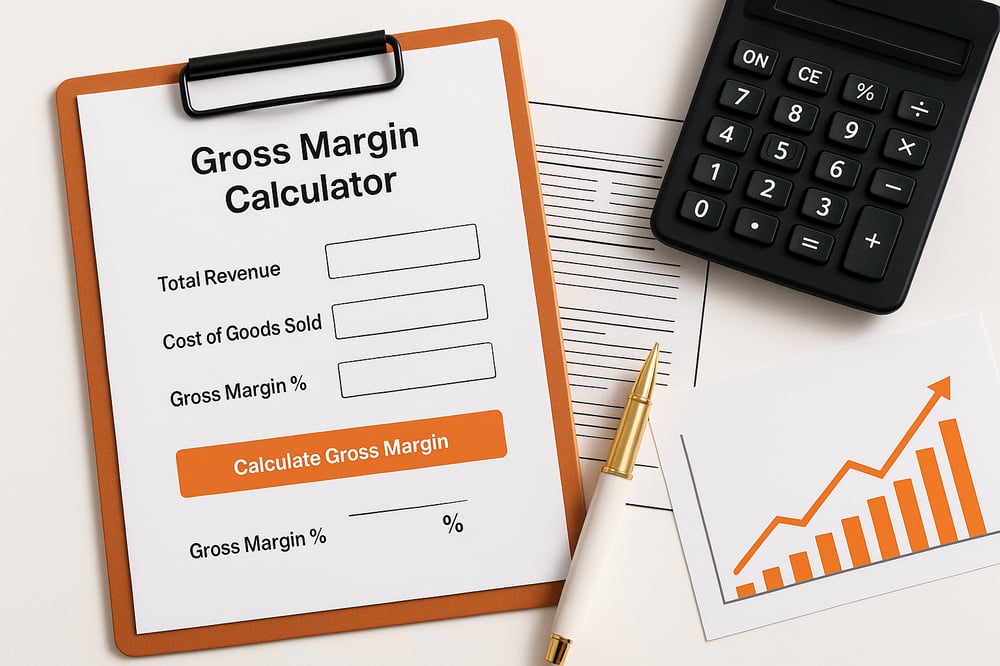
Struggling to see how much profit you’re really making on each sale? Our Gross Margin Calculator makes it easy to measure your true earning power.
Whether you’re pricing new products, evaluating vendor costs, or reviewing performance, this tool gives you a clear picture of how much you keep after covering direct expenses – fast, simple, and accurate.
Use it now to refine your pricing strategy, boost profitability, and make better business decisions with confidence.
Mastering Every Component of the Gross Margin Calculator + Real Examples
Here’s a comprehensive breakdown of each component in the Gross Margin Calculator, complete with practical examples and business scenarios to help you understand how this tool impacts your profitability analysis and financial decision-making.
1. Total Revenue Input
This field captures your complete sales income from all revenue streams before any cost deductions, representing your gross sales performance.
Examples:
E-commerce Fashion Store:
- Revenue: $85,000 monthly
- Multi-channel sales approach
- Average order value: $67
B2B Software Company:
- Revenue: $450,000 quarterly
- Subscription-based model
- Enterprise client focus
Manufacturing Business:
- Revenue: $1,200,000 annually
- Industrial equipment sales
- Contract-based revenue
Why It Matters: Total revenue serves as the foundation metric for all profitability calculations and determines your market positioning and growth trajectory.
2. Cost of Goods Sold (COGS) Input
This component captures all direct costs associated with producing or acquiring the products you sell, including materials, manufacturing, and product-specific expenses.
Examples:
Private Label Electronics:
- COGS: $28,000 on $70,000 revenue
- Manufacturing costs: $22 per unit
- Includes: Components, assembly, quality control
Food & Beverage Business:
- COGS: $180,000 on $400,000 revenue
- Raw ingredients and packaging
- Production facility overhead
Dropshipping Operation:
- COGS: $35,000 on $85,000 revenue
- Wholesale purchase prices
- Supplier fees and import duties
Why It Matters: COGS directly determines your gross profitability and reveals the efficiency of your production or sourcing operations.
3. Calculate Gross Margin Button
This triggers the instant computation of your profitability metrics using the standard industry formula for margin analysis.
Calculation Process:
- Computes gross profit amount (Revenue – COGS)
- Calculates margin percentage
- Provides real-time financial insights
Why It Matters: Immediate calculation enables quick strategic decisions for pricing adjustments, cost optimization, and business planning initiatives.
4. Gross Margin Percentage Display
The calculator shows your profitability percentage with contextual analysis based on industry benchmarks and business performance standards.
Example Results and Interpretations:
Excellent Performance (60 %+ margin):
- Scenario: SaaS platform
- Revenue: $200,000, COGS: $65,000
- Interpretation: Premium positioning with strong value proposition
Strong Profitability (40-60% margin):
- Scenario: Specialty retail brand
- Revenue: $150,000, COGS: $75,000
- Interpretation: Healthy margins supporting growth investments
Moderate Performance (20-40% margin):
- Scenario: Manufacturing operation
- Revenue: $500,000, COGS: $350,000
- Interpretation: Industry-standard with optimization opportunities
Needs Improvement (Below 20% margin):
- Scenario: Commodity reseller
- Revenue: $800,000, COGS: $680,000
- Interpretation: Volume-dependent model requiring cost focus
5. Gross Profit Dollar Amount
This displays the absolute profit value remaining after subtracting COGS from total revenue.
Examples:
High-Margin Service Business:
- Gross Profit: $72,000 (80% margin)
- Revenue: $90,000, COGS: $18,000
- Exceptional cash generation capability
Product-Based Company:
- Gross Profit: $125,000 (35% margin)
- Revenue: $357,000, COGS: $232,000
- Solid profitability for reinvestment
Why It Matters: Gross profit represents the actual cash available to cover operating expenses, marketing investments, and business expansion activities.
6. Performance Status Guidance
The calculator provides strategic recommendations based on your calculated margins compared to industry standards and best practices.
Status Categories:
“Excellent margin – very profitable business”
- Indicates market leadership potential
- Strong competitive differentiation
- Premium customer value delivery
“Good margin – strong profitability”
- Represents solid business fundamentals
- Healthy cash flow generation
- Growth investment capacity
“Moderate margin – room for improvement”
- Suggests optimization potential
- Cost structure review needed
- Pricing strategy evaluation
“Low margin – consider optimizing costs”
- Requires immediate attention
- Cost reduction initiatives are needed
- Business model assessment
Complete Business Analysis Examples
Scenario: Subscription Box Service
Input Values:
- Revenue: $240,000 (quarterly recurring)
- COGS: $96,000 (products + packaging)
- Business Model: Monthly lifestyle products
Calculation Results:
- Gross Profit: $144,000
- Gross Margin: 60.0%
- Status: Excellent margin – very profitable business
Analysis:
- Strong subscription economics with predictable revenue
- Efficient product curation and sourcing
- High customer retention value
Scenario: Manufacturing Company
Input Values:
- Revenue: $960,000 (annual production)
- COGS: $672,000 (materials + production)
- Business Model: Industrial components
Calculation Results:
- Gross Profit: $288,000
- Gross Margin: 30.0%
- Status: Moderate margin – room for improvement
Analysis:
- Typical manufacturing margins for the industry
- Opportunity for process optimization
- Scale economies potential
Scenario: E-commerce Beauty Brand
Input Values:
- Revenue: $180,000 (launch year)
- COGS: $63,000 (formulation + packaging)
- Business Model: Direct-to-consumer skincare
Calculation Results:
- Gross Profit: $117,000
- Gross Margin: 65.0%
- Status: Excellent margin – very profitable business
Analysis:
- Outstanding beauty industry margins
- Effective brand positioning
- Strong customer value perception
Understanding these calculator components helps business leaders and financial analysts make informed decisions about cost management, pricing optimization, and profitability enhancement while ensuring accurate financial analysis for strategic planning and stakeholder communications.
Game-Changing Strategies to Boost Your Gross Margin Today
Want to increase your profitability without raising prices? These proven strategies help businesses improve their gross margins by optimizing costs and operational efficiency. Each method can be implemented immediately to start seeing results in your next quarterly review.

Optimize Supplier Costs Through Strategic Sourcing
The fastest way to improve your gross margin is by reducing what you pay for products. This doesn’t mean compromising on quality—it means being smarter about sourcing and negotiation.
- Negotiate volume discounts by committing to larger orders (15-25% cost reduction possible)
- Diversify your supplier base to create competition and avoid single-source dependency
- Explore alternative sourcing locations to find better pricing without sacrificing quality
- Request payment term improvements (30-day vs 15-day payment terms can improve cash flow)
- Ask for seasonal pricing programs during suppliers’ slow periods
Pro Tip: If you can’t afford larger orders upfront, ask suppliers about “commitment contracts” where you guarantee annual volume in exchange for better per-unit pricing throughout the year.
Reduce Fulfillment Expenses with Smart Operations
Fulfillment costs can quietly eat away at your margins, but strategic optimization can save 20-40% on these expenses through operational improvements.
- Consolidate multiple items into single shipments whenever possible
- Partner with ecommerce fulfillment providers to leverage their economies of scale and better shipping rates
- Optimize warehouse layout by placing fast-moving items closest to packing stations
- Implement automated picking systems to reduce labor time per order
- Use zone skipping strategies to reduce shipping distances and costs
Pro Tip: Track your “cost per shipment” metric monthly. If it’s increasing, investigate immediately – small changes compound quickly across thousands of orders.
Improve Packaging Efficiency for Cost and Sustainability
Right-sized packaging is one of the most overlooked margin improvement opportunities, often reducing costs by 15-30% while improving customer experience.
- Invest in variable-sized packaging to match product dimensions precisely
- Reduce unnecessary packaging materials like excessive bubble wrap or filler
- Purchase packaging materials in bulk to secure 20-40% better pricing
- Switch to lightweight alternatives that reduce dimensional weight charges
- Design custom packaging for your top-selling products to maximize efficiency
Pro Tip: Calculate your “packaging cost per dollar of product value” ratio. If it’s above 3-5%, you have significant optimization opportunities.
Negotiate Better Shipping Rates Through Volume and Strategy
Shipping costs directly impact your gross margin, but most businesses accept default rates without negotiating. Even small businesses can often secure meaningful discounts.
- Contact carriers directly for volume discounts if you ship 500+ packages monthly
- Implement a multi-carrier strategy using different providers for different regions
- Negotiate zone skipping rates for shipments to distant markets
- Request fuel surcharge caps during volatile fuel price periods
- Ask for dimensional weight discounts if you ship lightweight, bulky items
Pro Tip: Audit your shipping costs quarterly. Carriers regularly adjust rates and programs – what was competitive last year might be overpriced today.
Implement Dynamic Pricing for Maximum Profitability
Dynamic pricing adjusts your prices based on demand, competition, and market conditions to maximize margins without losing sales, potentially increasing profits by 15-25%.
- Monitor competitor pricing daily using automated tools to identify pricing opportunities
- Implement demand-based pricing during high-traffic periods and holidays
- Create strategic product bundles that increase average order value
- Use A/B testing to find optimal price points for new products
- Set up automated repricing rules for competitive markets
Pro Tip: Start with 5-10% price increases on your best-selling products first. Customers are often less price-sensitive to products they already love.
Critical Gross Margin Calculation Mistakes That Are Costing You Money
Even experienced business owners make costly errors when calculating gross margins. These mistakes can lead to poor pricing decisions, cash flow problems, and missed growth opportunities. Here’s how to avoid the most common pitfalls.

Forgetting Hidden Costs That Destroy Your Real Margins
The biggest mistake? Only counting obvious costs while ignoring hidden expenses that can reduce your actual margins by 10-20% or more.
- Payment processing fees (2.9% + $0.30 adds up to thousands monthly)
- Platform commissions from Amazon (15%), Etsy (6.5%), or other marketplaces
- Packaging and fulfillment labor if you’re handling operations in-house
- Storage and inventory carrying costs for products sitting in warehouses
- Quality control and inspection expenses before products ship
The Fix: Create a “hidden cost checklist” and review it monthly. Track these costs as a percentage of revenue to spot trends early and ensure accurate margin calculations.
Not Including Returns and Refunds in Your Analysis
Returns are part of doing business, but many companies calculate margins based only on completed sales, creating an unrealistic picture of profitability.
- Factor in your average return rate (typically 10-15% for e-commerce)
- Include return shipping costs, which you often absorb
- Account for restocking labor and processing time
- Consider damaged/unsellable returned items that represent 100% loss
- Track refunds without returns for digital or consumable products
The Solution: Calculate your “net gross margin” by reducing your standard gross margin by your return rate percentage for a more realistic profitability picture that accounts for actual business performance.
Mixing Up Markup vs Margin (And Why It Matters)
This confusion leads to pricing errors that can cost thousands in lost profits because the math works completely differently.
- Markup = Profit ÷ Cost (profit over what you paid)
- Margin = Profit ÷ Selling Price (profit over what the customer pays)
- 50% markup = 33% margin (not 50%!)
- To get 50% margin: Price = Cost ÷ 0.5 (not Cost × 1.5)
- Example: $20 cost for 50% margin = $40 price (not $30)
The Correction: Always use margin formulas for pricing decisions. Create a simple pricing calculator or formula sheet to ensure you’re using the correct calculation method and avoid costly underpricing mistakes.
Ignoring Seasonal Variations That Skew Your Analysis
Seasonal businesses often make decisions based on peak-season margins that don’t reflect year-round reality, leading to cash flow problems during slower periods.
- Track quarterly margin variations to understand seasonal patterns
- Calculate rolling 12-month averages for strategic planning
- Account for seasonal fluctuations cost-wise for raw materials or labor
- Recognize temporary volume discounts that boost margins artificially
- Plan inventory and pricing based on annual averages, not peak performance
The Strategy: Develop “seasonal margin profiles” for your business. Track which months typically show higher/lower margins and use this data for strategic planning to maintain consistent profitability year-round.
Use Margin Clarity to Eliminate Revenue Blind Spots
Understanding your gross margin isn’t just about numbers; it’s about gaining control over your business decisions. With our Gross Margin Calculator, you now have the clarity to identify hidden costs, price with precision, and optimize profitability across every product line.
Whether you’re scaling up or tightening operations, these insights empower you to take action confidently. Don’t let revenue mislead you; let margin visibility guide your next move.