Project Burn Rate Calculator: Track Spending Velocity and Remaining Budget in Real Time
Keeping your project on budget requires constant vigilance over spending patterns. A burn rate calculator helps you track how quickly your project budget is being consumed, identify spending trends, and forecast when funds will run out.
Whether you’re managing a construction project, software development initiative, or marketing campaign, understanding your burn rate ensures you can take corrective action before budget overruns derail your timeline and deliverables.
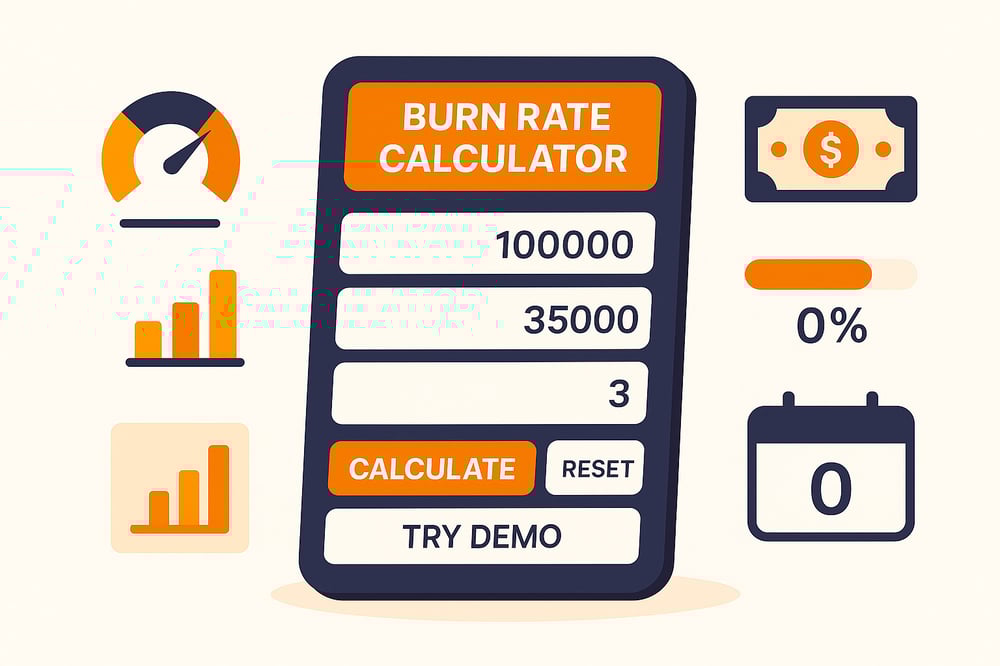
Project Burn Rate Calculator
Calculate how fast your budget is being used
Understanding Project Burn Rate and Why It Matters
Project burn rate measures how quickly you’re spending your allocated budget over time. Unlike general expense tracking, burn rate provides a rate-based metric that helps you understand spending velocity and predict when your budget will be exhausted based on current consumption patterns.
Monitoring your project’s burn rate impacts several critical aspects of project management:
- Budget forecasting: Knowing your burn rate helps you predict whether you’ll finish under, on, or over budget before it’s too late to course-correct
- Resource allocation: Identifying high-burn phases allows you to redistribute resources or adjust timelines to balance spending
- Stakeholder communication: Concrete burn rate data makes it easier to justify budget requests or explain why certain features need to be descoped
- Risk management: Early warning signs of unsustainable spending give you time to implement cost controls before funds are depleted
- Timeline adjustments: Understanding how much budget remains and your current spending rate helps you realistically estimate how many more months of work you can sustain
The burn rate expressed as a percentage shows what portion of your total budget has been consumed. If you’ve spent $35,000 of a $100,000 budget over three months, your burn rate is 35%. This percentage tells you at a glance how much budget runway you have remaining.
Monthly spend is equally important; it’s the average amount you’re spending per month. In the example above, your monthly spend is approximately $11,667 ($35,000 divided by 3 months). This figure helps you calculate how many months of budget you have left at your current spending pace.
How to Calculate Your Project’s Burn Rate
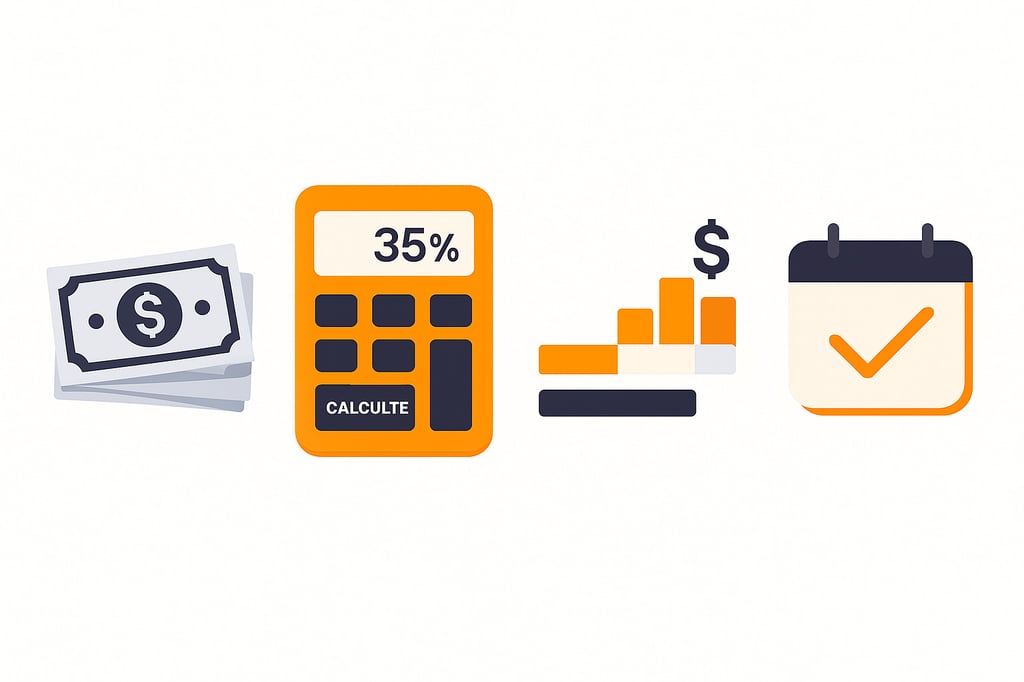
Calculating project burn rate requires three key pieces of information: your total budget, the amount spent so far, and how many months have passed. The calculator uses these inputs to generate multiple metrics that give you a complete picture of your project’s financial health.
The calculation process:
- Enter your total project budget in dollars; this is the full amount allocated for the entire project
- Input the amount spent to date, and the cumulative spending from project start to now
- Specify months completed, and how many months have elapsed since the project began
- Click calculate to see your burn rate percentage, monthly spend average, remaining budget, and months of runway left
For example, imagine you’re managing a website development project with a $100,000 budget. After three months, you’ve spent $35,000. Here’s what the calculator reveals:
- Monthly Spend: $11,667 (your average monthly spending rate)
- Burn Rate: 35% (the percentage of your budget consumed)
- Budget Left: $65,000 (your remaining funds)
- Months Left: 5.6 months (how long your remaining budget will last at the current spending rate)
Key metrics the calculator provides:
- Monthly spend: Your average spending per month, calculated by dividing total spent by the number of months completed. This is your baseline spending velocity
- Burn rate percentage: The portion of your budget already used, helping you see if you’re front-loading or back-loading expenses
- Remaining budget: Simple subtraction showing exactly how much funding you have left to complete the project
- Months of runway: How many more months can you sustain operations at your current monthly spend rate before funds are exhausted
The calculator also includes a visual progress bar that fills based on your burn rate percentage, making it easy to see budget consumption at a glance. Color-coded warnings alert you when your burn rate reaches concerning thresholds. Yellow warnings appear around 70% budget usage, while red alerts trigger near 90%.
Understanding these metrics together provides actionable intelligence. If your monthly spend is $12,000 but you have $60,000 remaining, you know you have five months of runway. If your project timeline shows you need eight months to complete, you have a funding gap that needs immediate attention.
Managing Budget Runway and Preventing Overruns
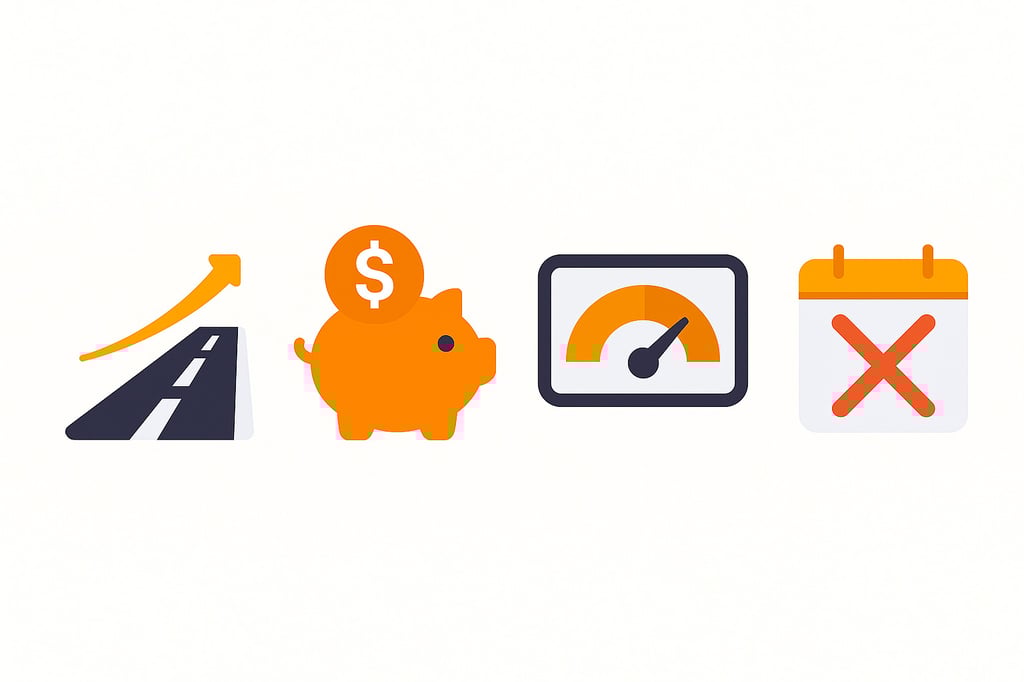
Once you know your burn rate and monthly spend, you can calculate your budget runway, the number of months your remaining funds will last at your current spending pace. This is your most critical planning metric because it tells you whether you’ll have enough budget to complete the project or need additional funding.
The months remaining calculation is straightforward: divide your remaining budget by your monthly spend. If you have $65,000 left and spend $11,667 monthly, you have 5.6 months of runway. Compare this to your project timeline to identify funding gaps early.
Warning thresholds to watch:
- Below 50% burn rate: Generally healthy if you’re in the first half of your project timeline
- 50-70% burn rate: Moderate spending that requires close monitoring and regular budget reviews
- 70-90% burn rate: High consumption zone where cost controls should be implemented immediately
- Above 90% burn rate: Critical status requiring emergency budget measures or additional funding approval
Strategies to extend your project runway without compromising deliverables:
- Prioritize must-have features: Focus spending on core requirements and defer nice-to-have elements to a later phase or version
- Negotiate vendor terms: Request extended payment schedules, bulk discounts, or milestone-based payments to improve cash flow timing
- Optimize resource allocation: Shift team members between tasks to avoid overtime costs and make better use of available capacity
- Review recurring expenses: Audit monthly subscriptions, software licenses, and service contracts for tools that aren’t providing value
- Implement approval thresholds: Require manager sign-off for purchases above certain amounts to prevent unnecessary spending
- Seek budget supplements: Present data-driven cases to stakeholders for additional funding when scope changes justify it
Smart project managers create contingency plans based on different scenarios. Calculate what happens if you reduce spending by 20%, or what features you’d need to cut if no additional budget becomes available. Having these plans ready means you can act quickly when budget pressure increases.
Common Mistakes and Best Practices
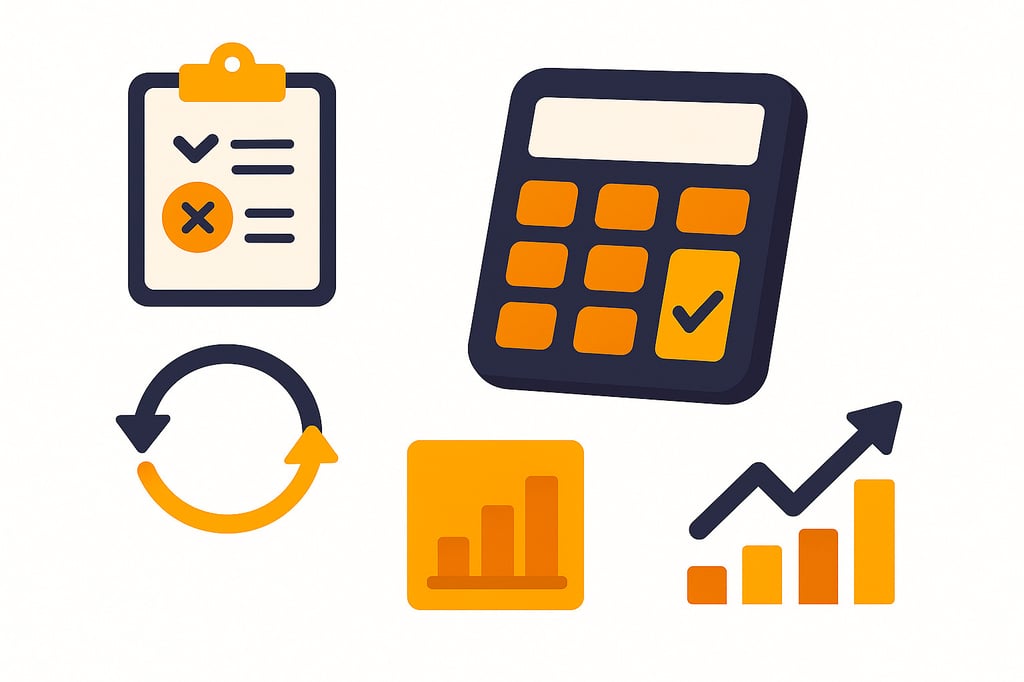
Even experienced project managers make errors when tracking and interpreting burn rate data. Avoiding these pitfalls helps you maintain budget discipline and make better resource allocation decisions.
Common mistakes to avoid:
- Ignoring phase-based spending: Many projects have uneven spending patterns, heavy upfront costs during setup, steady burn during execution, and tapering in final phases
- Forgetting committed costs: Purchase orders, contracted services, and approved expenses that haven’t been paid yet should be considered when evaluating your true remaining budget
- Confusing burn rate with project completion: A 50% burn rate doesn’t always mean you’re 50% done; some projects front-load or back-load expenses
- Not updating calculations regularly: Your burn rate changes as the project evolves, so monthly recalculations catch emerging issues before they become crises
- Overlooking scope changes: When stakeholders add requirements, your budget and timeline assumptions change, requiring burn rate recalculation
Best practices for burn rate management:
- Track burn rate weekly during critical project phases, monthly during steady-state periods
- Maintain a detailed expense log that categorizes spending by type (labor, materials, services, overhead) for better analysis
- Set burn rate alert thresholds at 50%, 70%, and 90% that trigger budget reviews with stakeholders
- Create spending forecasts for upcoming months based on planned activities and resource needs
- Compare your burn rate against your timeline completion percentage to identify spending misalignment early
Transparency with your team and stakeholders is crucial. When team members understand the project’s financial constraints, they make better daily decisions about resource use and can suggest cost-saving alternatives. Similarly, keeping stakeholders informed about burn rate trends prevents surprise budget requests and builds trust.
Use the calculator’s demo feature to model different scenarios before they happen. What if a key vendor increases rates by 20%? What if you need to add another team member? Running these projections helps you prepare contingency responses and understand how much buffer you really have.
Transform Raw Spending Data Into Smart Budget Decisions
Turning financial data into meaningful insight is the key to staying in control of your project. By consistently monitoring how funds are used, you can identify trends early, adjust priorities, and prevent costly overruns before they occur.
Regular analysis builds confidence in your financial planning, helps balance progress with spending, and ensures every resource supports measurable outcomes. When you understand where your money is going and why, you move from reacting to challenges to leading with strategy and precision, making every decision count.