Inventory Turnover Calculator: Get Accurate Turnover and DSI Without Spreadsheets
Not sure how efficiently you’re managing your inventory? The Inventory Turnover Calculator reveals how fast your products are moving and where money might be stuck on your shelves.
Turnover is a fast read on inventory health, but improving it means changing upstream practices — forecasting, reorder timing, SKU prioritization. Our complete guide to ecommerce stock management walks through the levers that actually move turnover over time.
Whether you’re tightening up cash flow, benchmarking supply chain performance, or planning your next stock order, this tool instantly shows how often you’re turning inventory into revenue.
Use it now to expose dead stock, optimize reordering, and take full control of your warehousing strategy, faster, clearer, and more actionable than a spreadsheet ever could.
Decoding Every Component of the Inventory Turnover Calculator + Real-World Business Scenarios
Here's a comprehensive breakdown of each element in the Inventory Turnover Calculator, featuring practical examples and business scenarios to help you optimize your inventory management strategy and operational efficiency.
1. Cost of Goods Sold (COGS) Input
This field captures the total direct costs of inventory sold during your specified period, forming the foundation of your turnover calculations.
Examples:
- E-commerce Store: $850,000 annually (electronics, accessories)
- Manufacturing Company: $2,200,000 annually (raw materials, labor, overhead)
- Fashion Boutique: $180,000 annually (wholesale clothing purchases)
Why It Matters: COGS accuracy determines your turnover ratio precision and reveals inventory cost efficiency.
2. Time Period Selection
Align your analysis with business cycles and seasonal patterns for accurate operational planning.
Examples:
- Annual (365 days): Strategic planning, year-over-year comparisons
- Quarterly (90 days): Regular reviews, trend monitoring
- Monthly (30 days): Fast-moving goods, perishable inventory
Why It Matters: Proper timeframe selection ensures DSI calculations reflect realistic business cycles.
3. Beginning Inventory Input
Your inventory value at the analysis period establishes the baseline for average inventory calculations.
Examples:
- Growing E-commerce: $320,000 (seasonal preparation for spring surge)
- Retail Chain: $1,850,000 (consistent stock across locations)
- Startup Brand: $85,000 (focused product lines, cash optimization)
Why It Matters: Accurate beginning inventory ensures reliable turnover insights reflecting true business conditions.
4. Ending Inventory Input
Your inventory value at period end reveals unsold stock levels and turnover efficiency.
Examples:
- Successful Launch: $180,000 (down from $320,000 - strong sales performance)
- Seasonal Challenge: $420,000 (up from $320,000 - slower sales requiring adjustments)
- Optimized Management: $305,000 (steady levels showing efficient forecasting)
Why It Matters: Ending inventory reveals management effectiveness and optimization opportunities.
5. Average Inventory Override (Optional)
Advanced feature for manual input when dealing with complex seasonal variations or sophisticated calculation methods.
Examples:
- Seasonal Retail: $480,000 manual average (accounting for holiday peaks vs. simple beginning/ending average)
- Multi-Location: $1,200,000 weighted average (different turnover rates across stores)
- Just-in-Time: $95,000 reflecting continuous flow operations
Why It Matters: Provides precision control for complex scenarios where standard calculations don't reflect reality.
6. Calculate Inventory Turnover Button
Triggers instant computation using industry-standard formulas for comprehensive performance analysis.
Calculation Process:
- Computes Turnover Ratio (COGS ÷ Average Inventory)
- Calculates Days Sales of Inventory (Time Period ÷ Turnover Ratio)
- Provides real-time insights
Why It Matters: Enables quick strategic decisions for inventory optimization and operational improvements.
7. Inventory Turnover Ratio Display
Shows your efficiency ratio with contextual analysis based on industry benchmarks.
Performance Examples:
Excellent (8.0x+ Turnover):
- Fast-fashion retailer: COGS $2.4M, Inventory $300K
- Outstanding efficiency with rapid stock movement
Good (4.0-8.0x Turnover):
- Electronics retailer: COGS $1.5M, Inventory $300K
- Healthy turnover supporting profitable operations
Moderate (2.0-4.0x Turnover):
- Furniture store: COGS $800K, Inventory $320K
- Acceptable for high-value, slower-moving items
Poor (Below 2.0x Turnover):
- Overstocked retailer: COGS $400K, Inventory $350K
- Immediate optimization is required for cash flow
8. Days Sales of Inventory (DSI) Display
Shows how many days your current inventory would last at the current sales pace, crucial for purchasing timing.
Example Scenarios:
- Fast-Moving Goods: 12.5 days (rapid replenishment needed)
- Seasonal Retailer: 45.6 days (strategic stock buildup for peak)
- Luxury Boutique: 125.8 days (premium positioning, longer cycles)
Why It Matters: Provides practical timing insights for reordering and cash flow optimization.
9. Performance Benchmark Guidance
Strategic recommendations based on calculated metrics compared to industry standards.
Status Categories:
- "✅ Excellent turnover": Exceptional performance, optimal cash flow
- "📈 Moderate turnover": Solid fundamentals, improvement opportunities
- "⚠️ Low turnover": Immediate attention required, strategic review needed
- "⚡ Very high turnover": Strong velocity, but monitor for stockouts
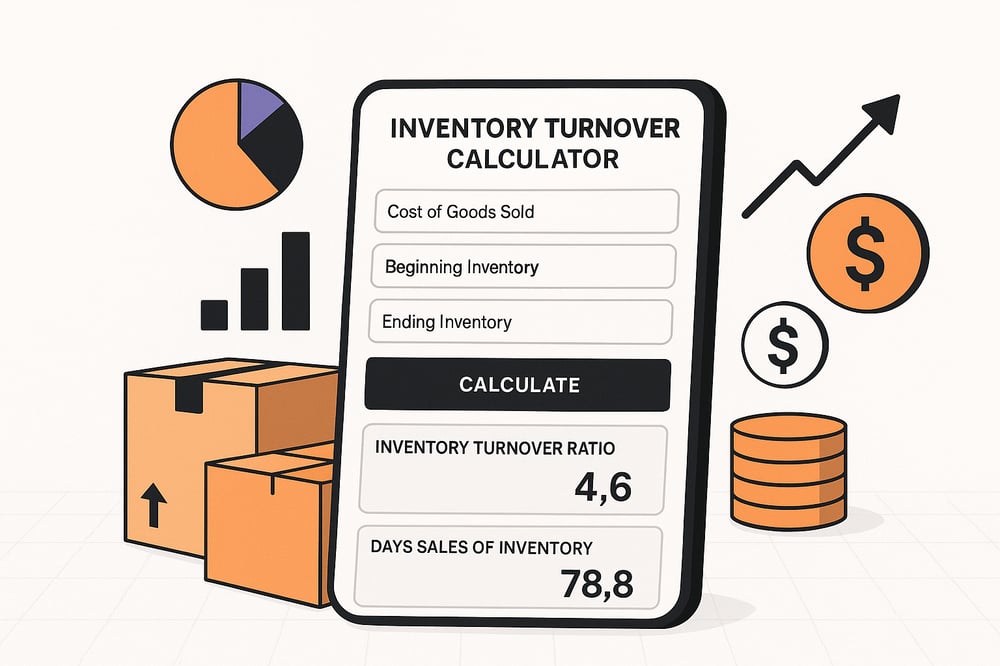
Complete Analysis Example
Scenario: Home Goods E-commerce Brand
Input Values:
- COGS: $1,850,000 (annual)
- Beginning Inventory: $420,000
- Ending Inventory: $380,000
- Average Inventory: $400,000
Results:
- Turnover Ratio: 4.63x
- DSI: 78.8 days
- Status: Good Performance
Analysis: Strong operational efficiency indicates effective demand planning. Healthy turnover rate for the home goods industry with balanced inventory levels supporting consistent sales.
Strategic Recommendations:
- Analyze top-performing categories for increased investment
- Implement seasonal adjustments for holiday peaks
- Test faster-moving product lines to improve overall turnover
- Monitor competitor strategies for market positioning
Understanding these calculator components empowers inventory managers and business owners to make informed decisions about purchasing optimization, cash flow management, and operational efficiency while ensuring accurate performance measurement for sustainable growth.
Transform Your Bottom Line: How Inventory Turnover Drives eCommerce Profitability
Understanding inventory turnover isn't just about moving products faster; it's about unlocking hidden profits and optimizing every dollar invested in your business. Here's how smart turnover management directly impacts your financial success and operational efficiency.

The Storage Cost Connection: Why Speed Equals Savings
Warehouse expenses eat into profits every single day your inventory sits unsold. The longer products remain on shelves, the more you're paying in hidden holding costs that can devastate your margins.
Key Storage Cost Factors:
- Warehouse rent is calculated per square foot occupied
- Insurance premiums are based on the total inventory value
- Utilities and climate control for product preservation
- Security systems and theft prevention measures
- Staff wages for inventory management and handling
Pro Tip: Calculate your daily holding cost per unit by dividing total monthly storage expenses by average inventory units. This reveals the true cost of slow-moving products.
Capital Efficiency: Free Up Cash for Growth Opportunities
Poor inventory turnover ties up precious capital that could fuel business expansion, marketing campaigns, or new product development. High turnover rates create a cash flow engine that powers sustainable growth.
Capital Efficiency Benefits:
- Faster cash conversion from inventory investments
- Reduced borrowing costs for working capital needs
- Increased buying power for volume discounts with suppliers
- Investment flexibility for seasonal opportunities and promotions
- Lower financial risk from market changes and trends
Pro Tip: Track your cash-to-cash cycle time—the days between paying suppliers and collecting from customers. Faster inventory turnover directly shortens this cycle.
Profit Margin Protection: The Quality-Time Relationship
Product freshness and quality deterioration directly impact your ability to maintain premium pricing and customer satisfaction. Smart turnover management preserves product value and protects margins.
Quality Impact Areas:
- Fashion and seasonal items are losing relevance and appeal
- Technology products are becoming outdated with new releases
- Perishable goods requiring markdowns before expiration
- Beauty and cosmetics with shelf life limitations
- Trend-based products are losing market demand over time
Pro Tip: Implement first-in-first-out (FIFO) rotation systems and set automated alerts for products approaching their optimal selling window.
High vs. Low Turnover: The Profitability Trade-offs
High turnover (8x+ annually) can signal strong demand but may create operational challenges that impact profitability if not managed carefully.
High Turnover Challenges:
- Stockout risks leading to lost sales and customer frustration
- Rush shipping costs for emergency replenishment
- Bulk discount losses from smaller, frequent orders
- Quality control issues from accelerated fulfillment processes
Low turnover (below 2x annually) creates different profitability pressures through increased carrying costs and reduced cash flow velocity.
Low Turnover Consequences:
- Escalating storage fees are consuming profit margins
- Obsolescence risks requiring deep discounts or write-offs
- Opportunity costs from capital tied up in slow-moving stock
- Insurance and tax burdens on high-value stagnant inventory
Pro Tip: Monitor your turnover velocity by product category - different items require different optimization strategies for maximum profitability.
Supercharge Your Success: Proven Strategies to Boost Inventory Turnover Ratio
Inventory optimization isn't one-size-fits-all. Your current turnover rate determines which strategies will deliver the biggest impact on your business performance and profitability.

Rescue Low Turnover Performance (Below 2x): Emergency Action Plan
Immediate intervention is critical when turnover drops below 2x annually. These strategies focus on rapid inventory liquidation and process improvements to restore healthy cash flow.
Urgent Actions Required:
- Aggressive markdown campaigns (20-50% discounts) for slow-moving SKUs
- Bundle promotions combining slow movers with popular products
- Flash sales and limited-time offers to create urgency
- Liquidation partnerships with discount retailers or outlet channels
- Supplier return negotiations for unopened, unsold merchandise
Pro Tip: Use ABC analysis to identify your bottom 20% of products by velocity—these items need immediate attention or elimination from your catalog.
Optimize Moderate Performance (2-4x): Strategic Enhancement
Moderate turnover indicates solid fundamentals but reveals significant improvement opportunities. Focus on fine-tuning your product mix and marketing approach for better results.
Strategic Improvements:
- Velocity-based product prioritization in marketing budgets and website placement
- Cross-selling strategies to move complementary, slow-moving items
- Seasonal promotion timing aligned with demand patterns
- Supplier negotiation for better terms on fast-moving products
- Inventory rebalancing toward higher-performing categories
Pro Tip: Implement 80/20 rule analysis - typically, 20% of your products generate 80% of your turnover. Double down on promoting these high-performers while reducing slow-mover investments.
Manage High Performance (8x+): Sustainability Focus
Exceptional turnover rates signal strong market demand but require careful management to maintain customer satisfaction and avoid stockouts that damage long-term profitability.
Sustainability Strategies:
- Safety stock calculations based on lead time variability and demand fluctuations
- Supplier reliability audits and backup vendor development
- Automated reorder systems with multiple trigger points
- Customer communication about availability and shipping expectations
- Demand forecasting refinement using advanced analytics and seasonality data
Pro Tip: Set up stockout alerts at 75% inventory depletion rather than waiting until you're completely out. This provides buffer time for emergency replenishment without disappointing customers.
Universal Optimization Tactics: Works for Every Turnover Level
Smart businesses implement these foundational strategies regardless of their current turnover performance to ensure continuous improvement and market responsiveness.
Always-Effective Strategies:
- Real-time inventory tracking with automated reporting and alerts
- Customer behavior analysis to predict demand patterns and preferences
- Competitor monitoring for pricing and promotion intelligence
- Supplier relationship management for better terms and priority treatment
- Technology integration linking inventory, sales, and marketing data
Pro Tip: Review your turnover ratios monthly by product category rather than just overall business metrics. This granular approach reveals hidden opportunities and problem areas requiring immediate attention.
Make Smarter Stocking and Reordering Decisions Instantly
With the Inventory Turnover Calculator, you’re no longer guessing; you’re making informed decisions backed by real numbers. From uncovering dead stock to improving cash flow and reordering smarter, this tool gives you instant clarity on how efficiently your inventory is moving.
Whether you're managing one SKU or hundreds, use your turnover and DSI insights to fine-tune your strategy, reduce waste, and boost profitability. Run the numbers now and turn inventory management into your competitive edge.