If you’re one of the over one million merchants who do business through the Shopify platform, you’ll want to take advantage of their analytics platform. Offering a highly customizable and powerful suite of analytics options, e-commerce analytics in Shopify are deeply and seamlessly integrated into the service.
The options available to you, however, will change depending on which subscription you have active. Additionally, you can make use of the customizable reports found in Shopify analytics to create data visualizations uniquely suited to your needs.
But just what does e-commerce analytics in Shopify measure? And how can you use it? Continue reading below to find out!
Different Account Levels of Shopify
As we briefly mentioned earlier, different levels of the Shopify subscription will entitle you to different levels of access to their analytics suite.
Basic
Basic users can access acquisition and inventory reports. They can also see most behavior reports and a single marketing report. They cannot, however, see the following data:
- Sales and retail sales reports
- Profit Reports
- Customer Reports
Basic users are also not entitled to create custom reports.
The key takeaway is that, while basic users will be able to keep track of their website visitors over time and manage their inventory, their ability to develop insights about their users’ behavior on their online store will be limited.
An inability to see sales, customer, and profit reports also makes it difficult for basic users to get a complete handle on where they may wish to focus their marketing and customer acquisition efforts.
Standard
The “standard” plan, just called the “Shopify” plan, is where the real analytics action starts. These users get access to virtually every report available. The only exceptions that remain off-limits are a handful of customer reports (the At-risk Customer Report and Loyal Customer Report are unavailable.) Standard users also can’t create custom reports.
That said, Standard users can access a wealth of information that almost any e-commerce business owner would find useful.
Advanced
Advanced users can access every single e-commerce analytics report in Shopify. They can also set up and run custom reports they design specifically for their own needs.
The Overview Dashboard
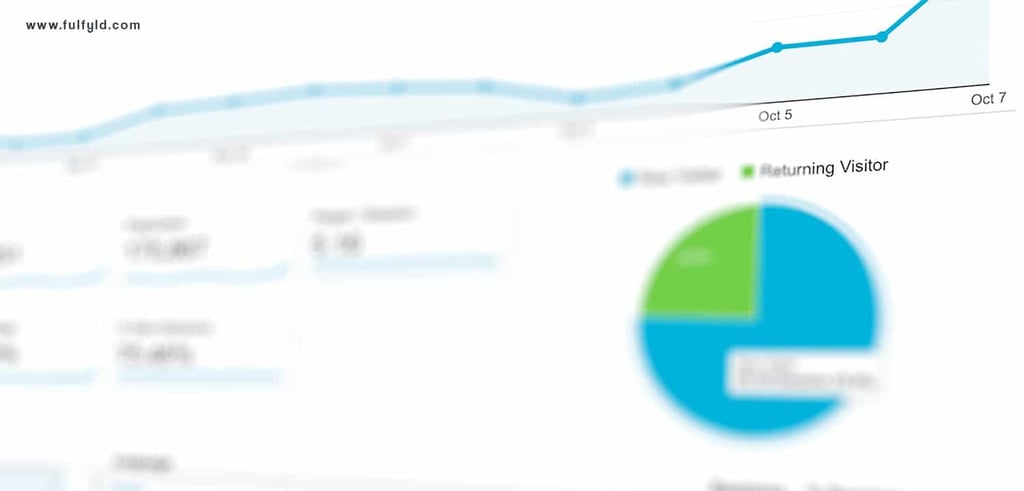
When you log in to e-commerce analytics in Shopify you’re greeted by the Overview dashboard. A quick glance at the cards on this board will provide you with a ton of information. You’ll see your:
- Total sales
- Store sessions
- Returning customer rate
- Conversion rate
- Total orders
- Average order value
You can customize the dashboard to show you values for these metrics for different time ranges. Additionally, the dashboard will default to showing you your metrics compared to a period of time in the past. For example, if you’ve got the time range set to the last thirty days, the charts will compare what you’ve achieved in the last thirty days to the thirty day period prior to that.
Before you dive deeper with the other metrics we’ll discuss in this article, make sure that you’re comfortable and familiar with the information you’re presented with on the Overview dashboard.
Shopify Metrics
Shopify tracks metrics in a variety of areas. All of them can be useful to an e-commerce business if they’re put to the correct use.
Traffic
Shopify groups traffic- and visitor-related metrics under the Acquisition Reports tab. It allows you to view your web traffic in three ways:
- Over time
Seeing your visitor data over time can reveal seasonality and other trends. Some websites seem to be particularly active at certain times of the day (for example, if they’re frequently used while people are at work), while others see more significant trends over the entire year.
Time trends can be used to optimize your marketing, time your website maintenance for minimal disruption, or even decide when to introduce new products or sales.
- By referrer
Referrers indicate how people are arriving at your site. This report will tell you what proportion of your visitors arrive directly at your pages (by typing your site name into their address bar or clicking a bookmark) and how many arrive by other means (perhaps through links found on social media, or Google.
Referrer data can be extremely useful for focusing your marketing efforts. For example, if you find that you have very little organic search traffic, you may wish to invest in search engine optimization (SEO). If you have low social referrer numbers, you may wish to increase your visibility on Facebook, Instagram, or Twitter.
- By location
This segmentation splits users into different geographies. You’ll see where your users are accessing your site from. Insights gleaned from this data can help show you where to focus your marketing efforts, and if your offerings are particularly attractive or unattractive in specific areas.
Sales
Shopify users on the “Shopify” (Standard) plan or higher can view sales reports. These reports track everything from total orders to returns and discounts.
While you can learn a lot from aggregated reports like these, where the e-commerce analytics in Shopify really shine are in the more highly segmented reports.
You can split your sales into a variety of metrics. For example, you can view all of the sales you made to people who were referred to your site by social media. Or you can see all of the sales made to customers in a particular region. You can even see how your average order value changes over time to keep an eye on whether your ability to upsell customers is increasing or stagnating.
Visitor Behavior
Allowing a deeper dive into visitor behavior than what’s permitted by the Acquisition Reports, Behavior Reports reveal trends and insights into what your visitors do on your page.
Perhaps one of the most useful parts of this section is the Top Online Store Search report. Not only can you learn what people are searching for on your site, but you can also drill down even further and see the most popular searches that revealed no results. In other words, you can find out what people are searching for that you don’t yet offer.
You can also get valuable data on what products people tend to add to their cart together, as well as find out how well your product recommendations are converting.
Profit
To see information about how all your revenue translates into money in your pocket you should look to the Profit Reports.
It will come as no surprise to any e-commerce business owner that particular products tend to fly off the shelves while others tend to move much slower. What’s often less obvious is whether the fast-movers are as profitable as the other products in your store.
E-commerce analytics in Shopify allows you to closely examine how each product contributes to your bottom-line profit. You can add how much each item costs you to make and sell, and learn how discounts and refunds are affecting your profitability.
Customer
Customer reports are where you get detailed customer-level insights and data. In other words, this section is where you can access actionable insights specific to individual customers.
The Loyal and At-Risk Customer Reports available to Advanced Shopify users are particularly interesting. These categorizations use machine learning to determine which customers are most likely to make future purchases from your store and which ones are at a significant risk of failing to make a repeat purchase.
You can use this data to tailor your marketing specifically to these groups of people.
Customizing Reports
E-commerce analytics in Shopify is only useful if you can use the data to make intelligent decisions. Shopify Advanced users have access to customized reports and filtered data that allow them to access insights and data which might otherwise remain hidden.
You can customize reports in almost every way imaginable. You could apply a specific product filter to your Sales by Month report to see how that product was performing over time. You could access data pertaining to a particular sales associate to see which products he or she was best at selling.
What’s important to keep in mind when customizing reports is that you don’t need data for data’s sake. Consider your e-commerce business’ strategy and find out what data are germane to the issues you face and the decisions you have to make. Then, craft reports that can help you address those issues and make those decisions.
Final Thoughts
We’ve barely scratched the surface of the possibilities of e-commerce analytics in Shopify. The platform offers a powerful suite of software that would be of use to virtually anyone in the e-commerce industry.
If you happen to use the platform, do yourself a favor and familiarize yourself with the analytics features contained within. Failing to take advantage of the information you can access from the analytics dashboard would leave you blind to the innumerable insights you could draw from the user-friendly and information-rich reports.