

Every year, thousands of startups chase financial stability, and most of them skip the one number that actually proves the business works: the breakeven point. It won’t show up on a pitch deck’s hockey stick chart. But it’s the clearest signal you have that your pricing, costs, and sales volume actually add up.
How to Calculate Your Breakeven Point
This break-even analysis template walks you through three inputs: fixed costs, variable costs per unit, and your selling price. Plug those numbers into the free calculator, and the sheet does the math for you, no email required and nothing to sign up for.
It’s the same downloadable Excel workbook our account managers walk clients through when building a pricing model for a new product line. Change the price, cost, or volume, and the numbers update instantly, so you can test a few scenarios before committing to real ones. The setup doubles as a standalone breakeven calculator template if you just want to test price points on their own.
The formula itself is simple. Getting the inputs right is where most founders trip themselves up.
Step 1: Separate Fixed and Variable Costs
Fixed costs stay the same no matter how much you sell. Variable costs move with every unit you produce.
| Cost Type | Examples | Behavior |
| Fixed costs | Rent, salaries, insurance, software subscriptions | Stays constant regardless of sales volume |
| Variable costs | Raw materials, packaging, shipping, sales commissions | Rises and falls with units produced |
Getting this split right matters. Lump a variable cost in with your fixed costs, and your breakeven number will be wrong, sometimes wildly so.
Step 2: Set Your Selling Price per Unit
Your price needs to do two jobs at once: cover the variable cost of making that unit, and leave something left over to chip away at your fixed costs. That leftover amount is your contribution margin, and it’s the engine behind the entire calculation.
Setting a price that’s both competitive and profitable means weighing a few things at once:
- Market dynamics and demand
- Customer behavior and price sensitivity
- Your actual production costs per unit
Pricing too low to win customers is a common trap. So is pricing without checking what competitors and customer expectations will actually bear. Both mistakes push your breakeven point further out of reach.
Step 3: Run the Formula
Breakeven point (in units) equals total fixed costs divided by contribution margin per unit, where contribution margin equals selling price minus variable cost per unit.
Say your fixed costs run $10,000 a month, your product sells for $50, and it costs $30 to make. Your contribution margin is $20, so you’d need to sell 500 units to break even that month. Sell fewer, and you’re operating at a loss; sell more, and every extra unit is pure profit.
Step 4: Read What the Number Tells You
If your actual sales sit above the breakeven line, you’re profitable. Fall below it, and you’re losing money on operations, even if revenue looks healthy on paper. A profit and loss statement confirms this after the fact; breakeven analysis is what sets the target before you get there. Track this monthly, not just once at launch.
Breakeven Point: Units or Dollars?

You can express your breakeven point in two different ways, and picking the right one depends on your business. Product-based startups usually want it in units, such as how many items you need to sell. Service or subscription businesses usually want it in dollars, how much revenue you need to bring in.
To get the dollar version, swap the contribution margin per unit for the contribution margin ratio:
- Contribution margin ratio = contribution margin ÷ selling price
- Breakeven point (dollars) = fixed costs ÷ contribution margin ratio
Using the earlier example, a $20 contribution margin on a $50 product gives a 40% ratio. Divide $10,000 by 0.40, and you’d need $25,000 in monthly revenue instead of counting units. If you’d rather skip the manual math, Fulfyld’s margin calculator runs that conversion for you.
Strategies to Lower Your Breakeven Point

A lower breakeven point means less risk and a shorter runway to profitability. Three levers get you there.
Cut Fixed Costs
- Renegotiate your lease or rent agreement
- Switch to a cheaper or more efficient supplier
- Move to a shared or flexible workspace
- Outsource accounting, IT, or marketing instead of hiring in-house
Trimming fixed overhead drops your breakeven number directly, since it’s the numerator in the formula.
Raise Your Selling Price, Carefully
A higher price improves your contribution margin, but push too hard, and you’ll lose price-sensitive customers. Test any increase against real market research before you commit to it. A few ways to raise revenue without just hiking the sticker price:
- Bundle products or services and test the math with a bundle price calculator
- Introduce a premium tier alongside your core offer
- Test small price increases on new customers first
Bundling is often an easier sell than a straight price hike, since it raises average order value without touching the price on any single item.
Grow Sales Volume
More units sold means the same fixed costs get spread thinner. A few levers that reliably move volume:
- Sharper marketing and sales campaigns
- Expanding into new customer segments
- Partnerships with complementary brands
- Improving retention and repeat purchase rate
Every additional sale pushes you closer to the breakeven line and past it.
Mistakes to Avoid in Breakeven Analysis
Even a solid template gives you bad answers if the inputs are sloppy. Watch for these:
- Miscategorizing costs. A variable cost hiding in your fixed cost bucket skews everything downstream.
- Using stale numbers. Supplier prices and rent change; your model should too.
- Assuming flat sales volume. Seasonality and demand swings mean your real breakeven shifts month to month.
- Ignoring outside factors. Regulatory changes, new competitors, and shifting consumer preferences all move your costs and your demand.
- Skipping cost structure reviews. Changes to your cost structure and revenue streams, like a new supplier contract or a new distribution channel, quietly shift your breakeven line if nobody rechecks the numbers.
Review your cost structure regularly, update pricing as the market moves, and treat this as a living calculation, not a one-time exercise.
Breakeven Point vs. Burn Rate and Runway
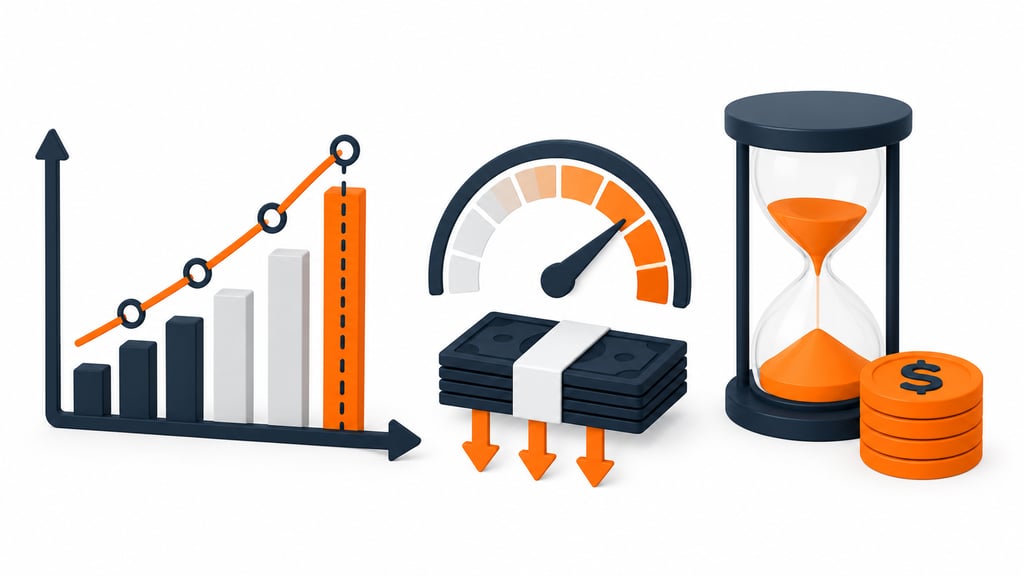
Founders often mix up three numbers that actually answer different questions. The break-even point tells you the sales level at which you stop losing money. Burn rate tells you how fast you’re spending cash each month before you get there. Runway tells you how many months you can keep spending at that rate before you run out.
A startup can have a healthy breakeven point on paper and still run into trouble if spending outpaces the plan along the way. If you’re also tracking how fast you’re burning through a budget, Fulfyld’s burn rate template covers that side of the math, so you can watch spend and breakeven progress side by side instead of guessing at either one.
Secure Your Startup’s Financial Future
Knowing your breakeven point is the beginning of financial wisdom for any founder. It tells you exactly how many units, dollars, or transactions stand between you and profitability, and it puts pricing, cost control, and sales strategy into one clear picture.
Review the numbers often, adjust as your costs shift, and you’ll stay ahead of cash flow problems instead of reacting to them. Grab the free calculator, fill in your real numbers, and see exactly where you stand with Fulfyld.
Templates track the work. We do the work.
This file will carry you a long way. But past a few hundred orders a month, tracking fulfillment in a spreadsheet becomes the bottleneck. That is the point of a 3PL: Fulfyld picks, packs, and ships every order under a formal SLA with automatic credits, one flat all-inclusive per-order price, and a dedicated account manager who knows your catalog.
Get a real quote