

A well-built profit and loss statement tells you, in one glance, whether your business made money last month or bled cash quietly while you weren’t looking. Track your revenue and expenses with any consistency, and you’ll spot weak spots before they become real problems.
Building one from a blank spreadsheet, though? That’s a slog. Formulas break, categories get mislabeled, and you end up second-guessing your own math.
An editable template fixes that; the structure is already there, so you just plug in your numbers.
What Is a P&L Template?
This kind of document is a pre-built spreadsheet you fill in with your own revenue and expense numbers instead of designing a report from scratch. Accountants also call the underlying document an income statement, and it’s one of the three core financial statements that lenders, investors, and your own bookkeeper will ask to see first.
The version below is a P&L template built directly in Excel: the columns, categories, and formulas are already wired up, so you open the file, drop in your numbers, and the totals calculate themselves. No blank spreadsheet, no formulas to write from memory.
Used consistently, this kind of report does more than satisfy a bookkeeping requirement. It’s how you make informed decisions about pricing, spending, and where the business is actually leaking money, instead of relying on a gut feeling about how last month went.
Who actually uses one:
- Ecommerce sellers checking monthly profitability by SKU or channel
- Founders prepping numbers for a lender or investor pitch
- Operators comparing this quarter’s costs against last quarter’s
- Bookkeepers are standardizing reports across multiple business units
Most operators run this every month, while lenders or investors often want it broken out by quarter or year instead.
Key Components of a Profit and Loss Statement
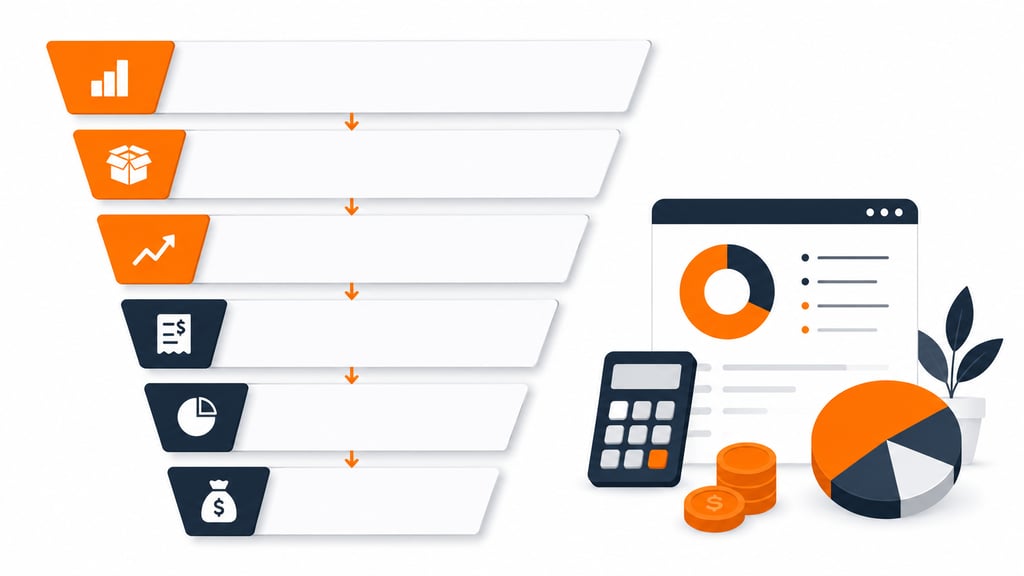
A profit and loss statement is built from a handful of core line items, and each one tells you something different about how your business is actually performing.
| Component | What It Measures | Why It Matters |
| Revenue | Total money earned from operations | Shows sales and marketing effectiveness |
| Cost of Goods Sold (COGS) | Direct costs of producing or delivering your product | Reflects production and fulfillment efficiency |
| Gross Profit | Revenue minus COGS | Shows the profitability of core operations |
| Operating Expenses | Rent, utilities, salaries, marketing, and similar overhead | Reveals the cost of simply running the business |
| Operating Income | Gross profit minus operating expenses | Represents overall operational profitability |
| Net Income | Final figure after taxes, interest, and all expenses | The bottom line: what you actually kept |
Each row feeds the next. Revenue sets the ceiling; COGS determines how much of that revenue survives production; operating expenses show what it costs just to keep the lights on. By the time you reach net income, you’re looking at the real, unvarnished result.
Quick ways to read the components:
- Strong revenue, thin gross profit: usually a pricing or sourcing problem, not a sales problem
- Healthy gross profit, shrinking operating income: usually bleeding cash on overhead
- Solid net income, weak gross profit: worth double-checking for a one-time gain skewing the total
Reading the components in sequence, rather than jumping straight to the bottom line, is what turns a P&L from a formality into an actual diagnostic tool. Want a faster read on just the margin? Our gross margin calculator does that single calculation in seconds.
P&L Statement vs. Balance Sheet vs. Cash Flow Statement
A profit and loss statement is one of three core financial statements, and it’s easy to blur it with the other two if you haven’t worked with all of them side by side.
The quick distinction:
- P&L statement: revenue, costs, and profit over a period, a month, a quarter, or a year
- Balance sheet: a snapshot of assets, liabilities, and equity on one specific date
- Cash flow statement: actual cash moving in and out, separate from revenue you’ve earned but not yet collected
Lenders and investors usually want all three together. A strong P&L doesn’t mean much if the balance sheet shows the business drowning in debt, or the cash flow statement shows revenue that hasn’t hit the bank account yet. If you need to build that piece too, our cash flow statement calculator handles it separately.
Customizing the Template for Your Business
No two businesses report revenue the same way, and a rigid template forces you to twist your numbers to fit boxes that don’t match how you actually operate. An editable version does the opposite: you add, remove, or rename line items until the structure matches your real revenue streams and cost categories.
A subscription box company might need separate revenue lines for one-time purchases versus recurring plans. A multi-channel seller might want COGS broken out by Amazon, Shopify, and wholesale separately, rather than lumped into one number.
Common ways sellers adjust the template:
- Splitting revenue by sales channel or product line
- Adding custom expense categories for marketing, storage, or software subscriptions
- Applying company colors, logo, and fonts for investor-ready formatting
- Adjusting formulas to reference a different fiscal year start date
Customization has limits, though. Whatever you change, the underlying math still has to follow standard accounting practice; renaming a line item is fine, but reclassifying COGS as an operating expense to make gross margin look better is not.
Accuracy comes first, always. Get that right, and you’ll customize reports to fit your unique business needs without ever compromising what the numbers actually mean.
Why an Editable Template Beats a Static PDF
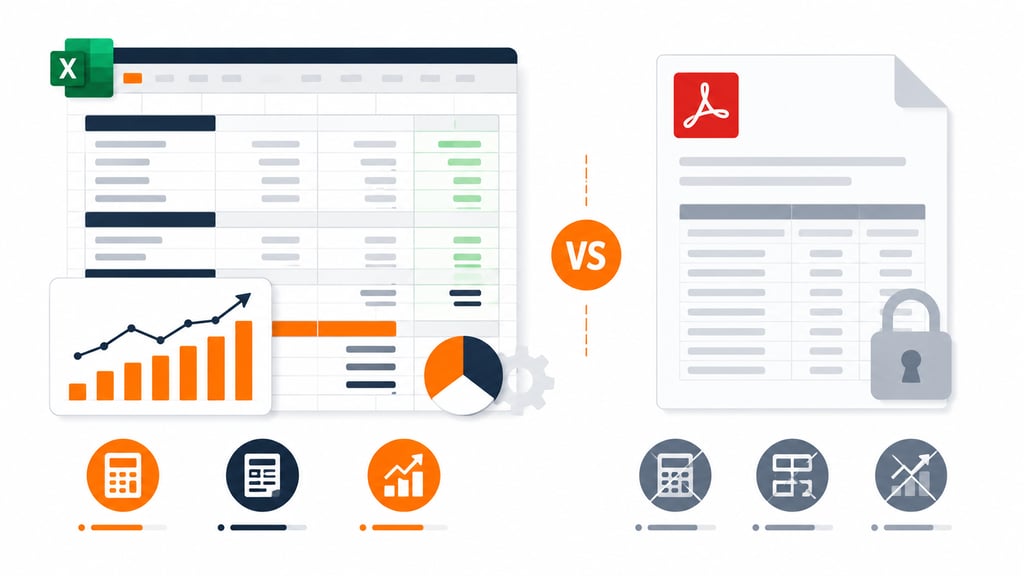
Not every spreadsheet labeled a financial reporting tool is actually useful. The traits below are what separate a real template from a glorified table, on top of the customization already covered above.
What to look for:
- Built-in accuracy: pre-loaded formulas calculate gross profit, operating income, and net income automatically, removing the manual math where typos and errors usually creep in
- Standardized presentation: investors, lenders, and partners read a lot of P&L statements, and a familiar structure means they can scan yours in seconds
- Forecasting capability: swap actuals for projected figures, and the same template becomes a forecast, useful for testing “what if” pricing or cost scenarios before committing to either one
Get these three right and the template stops being a chore; it becomes something you actually want to open each month.
Steps to Simplify Your Financial Reporting
Financial reporting eats more time than it should, mostly because the process around it is undisciplined rather than because the math is hard. These three steps fix that.
Streamline Data Collection
Set up a consistent process for tracking revenue, expenses, and COGS as they happen, not weeks later when you’re trying to remember what a charge was for.
- Log revenue and costs on a fixed schedule, weekly at minimum
- Auto-import transactions from bank feeds and invoices where possible
- Keep one source of truth, not scattered notes across apps
Automate Your Calculations
Once the formulas are in place, the discipline is leaving them alone and trusting the process instead of re-checking every total by hand.
- Reconcile the calculated totals against your bank statement each period
- Never type a number directly into a cell that holds a formula
- Let one changed line item ripple through the rest of the sheet automatically
Manual calculation is where most mistakes happen; trusting the automation removes that risk almost entirely.
Present the Data Clearly
Numbers in a dense table don’t communicate much on their own.
- Add a simple line chart to show revenue trends over time
- Use a pie chart to break expenses down by category
- Add short notes explaining any unusual swing, like a one-time expense or seasonal spike
That last step matters more than it seems; it’s the “why” behind the numbers, not just the totals, that helps a reader actually understand the report.
Maintaining Your Template Over Time
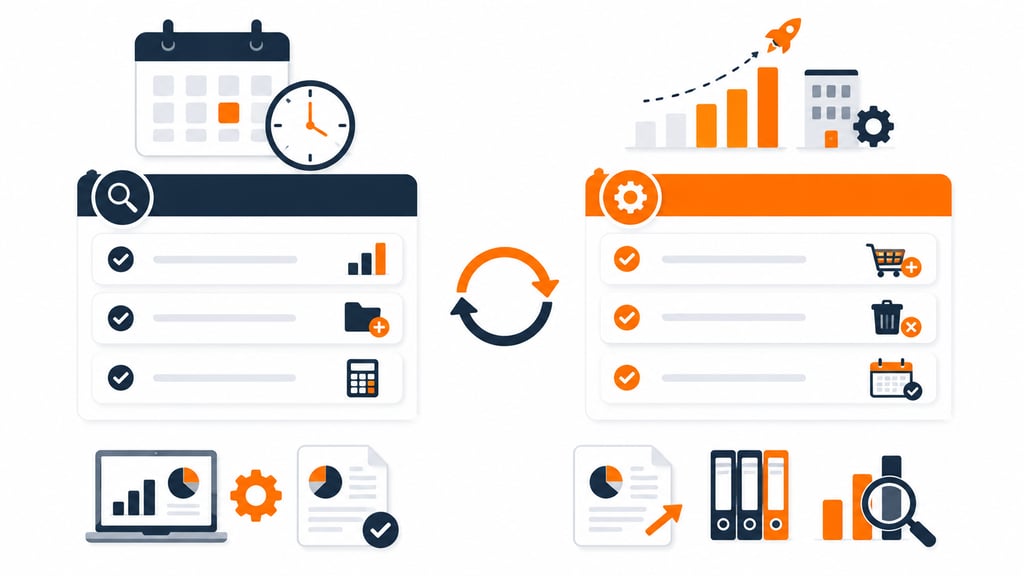
A template is only useful if someone keeps it current. Set a recurring reminder, monthly or quarterly, to review the categories and confirm they still match how the business actually runs.
Review and Adjust Regularly
Use each review to catch discrepancies early, before they compound into a bigger cleanup job later.
- Check that every expense category still fits how you actually spend
- Flag new expense categories that have crept in since the last update
- Confirm formulas still calculate correctly after any edits
Update for Operational Changes
Launch a new product line, expand into a new market, or cut costs somewhere significant, and your template needs to reflect that shift.
- Add a new revenue line when you launch a product or channel
- Retire categories that no longer apply to the business
- Re-check the fiscal year and reporting period after any structural change
A static report that doesn’t evolve with the business stops being useful pretty fast; it starts reporting a version of the company that no longer exists.
Download: Editable Profit and Loss Statement
Start Tracking Your Profit Today
A solid P&L shouldn’t be complicated to set up or a chore to maintain. Get the structure right once, customize it to your business, and update it on a regular schedule, and you’ve got a reporting tool that tells you something useful every time you open it.
Templates track the work. We do the work.
This file will carry you a long way. But past a few hundred orders a month, tracking fulfillment in a spreadsheet becomes the bottleneck. That is the point of a 3PL: Fulfyld picks, packs, and ships every order under a formal SLA with automatic credits, one flat all-inclusive per-order price, and a dedicated account manager who knows your catalog.
Get a real quote