Returns Management & Reverse Logistics: The Complete Operational Guide for E-Commerce Brands
U.S. consumers returned an estimated $890 billion in merchandise in 2024, according to the National Retail Federation. Yet most e-commerce brands treat reverse logistics as an afterthought bolted onto their forward fulfillment process.
A poorly managed return doesn’t just cost you the sale. It costs you the customer, the margin, and the inventory visibility you need to restock and resell.
This guide covers everything brands need to know: how returns management works inside a 3PL warehouse, what a best-in-class reverse logistics process looks like stage by stage, and how outsourcing returns to the right fulfillment partner turns a cost center into a competitive advantage.
What Is Returns Management: Definition, Scope & Business Impact
Returns management is the systematic process of receiving, inspecting, and disposing of products that customers send back.
It sits at the heart of every high-performing fulfillment operation, which is why growing brands often rely on dedicated returns management services to optimize the workflow.
So what is returns management, exactly? It refers to the end-to-end operational process a business uses to handle products flowing back through the supply chain after delivery, from the moment a customer initiates a return through final disposition.
It is not simply a “receive and restock” action. It’s a structured program involving authorization, intake, inspection, grading, inventory recovery, and data analysis.
Core components of a complete returns management program:
- Return authorization and customer communication
- Inbound return shipping coordination
- Physical receiving, intake, and logging in WMS
- Inspection, grading, and condition assessment
- Disposition decisions (restock, refurbish, liquidate, donate, dispose)
- Inventory adjustments and real-time system updates
- Returns data reporting and root cause analysis
What it encompasses in practice:
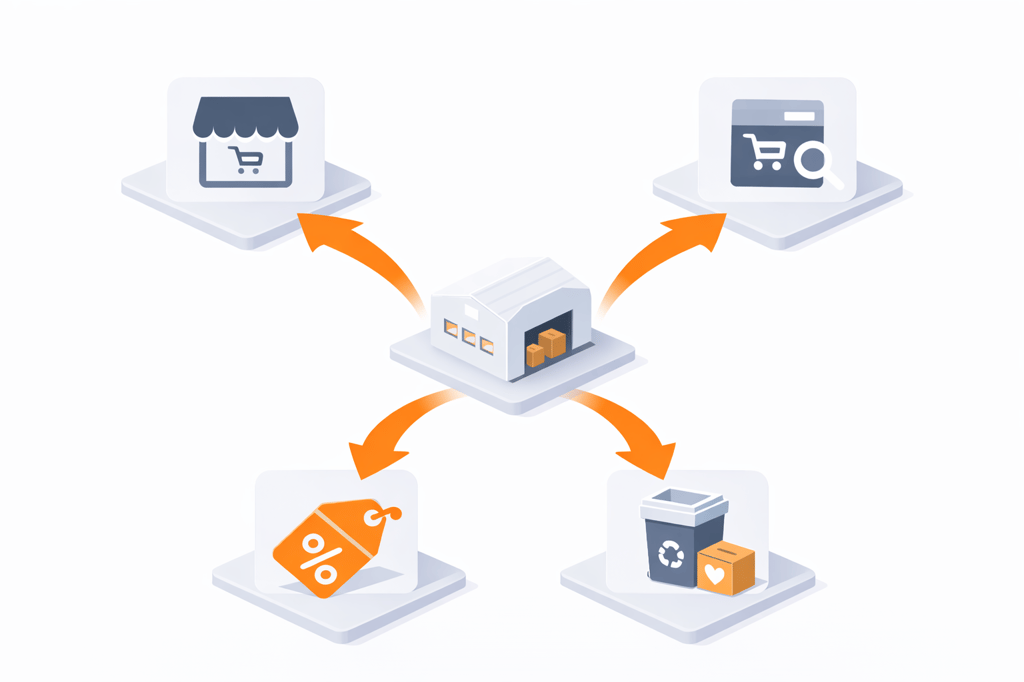
- Single-channel returns (website, Amazon, Shopify)
- Multi-channel and omnichannel returns routing
- Cross-border and international return flows
- B2B and DTC returns workflows
- Real-time visibility from customer initiation to final disposition
According to the National Retail Federation and Happy Returns, total retail returns reached $890 billion in 2024, representing 16.9% of all annual sales.
Online return rates run consistently higher; industry data from Capital One Shopping and others puts the e-commerce-specific return rate at approximately 20% for 2024, compared to roughly 8.9% for brick-and-mortar retail. For apparel, rates typically run 20-30%, with some fast-fashion segments running higher.
The business impact of returns management
Strategic returns management directly impacts customer retention, profit margins, inventory accuracy, cash flow, brand reputation, and operational efficiency. Processed returns restore sellable inventory that would otherwise be written off. Unprocessed returns create phantom stock, delayed refunds, and warehouse bottlenecks that compound over time.
Returned inventory only earns back margin when it gets back on the shelf accurately and quickly, which makes returns and core inventory ops two sides of the same operation. For the broader playbook on the inventory side, see our full ecommerce inventory management guide.
Reverse logistics services handled by a capable 3PL address every layer of this impact, transforming a cost center into a recoverable margin line.
For brands evaluating whether their current approach is sufficient, understanding the advantages of hiring a 3PL for e-commerce fulfillment, including returns, is the right starting point. Brands using dedicated e-commerce fulfillment services consistently report better inventory accuracy and faster refund cycles than those handling returns informally in-house.
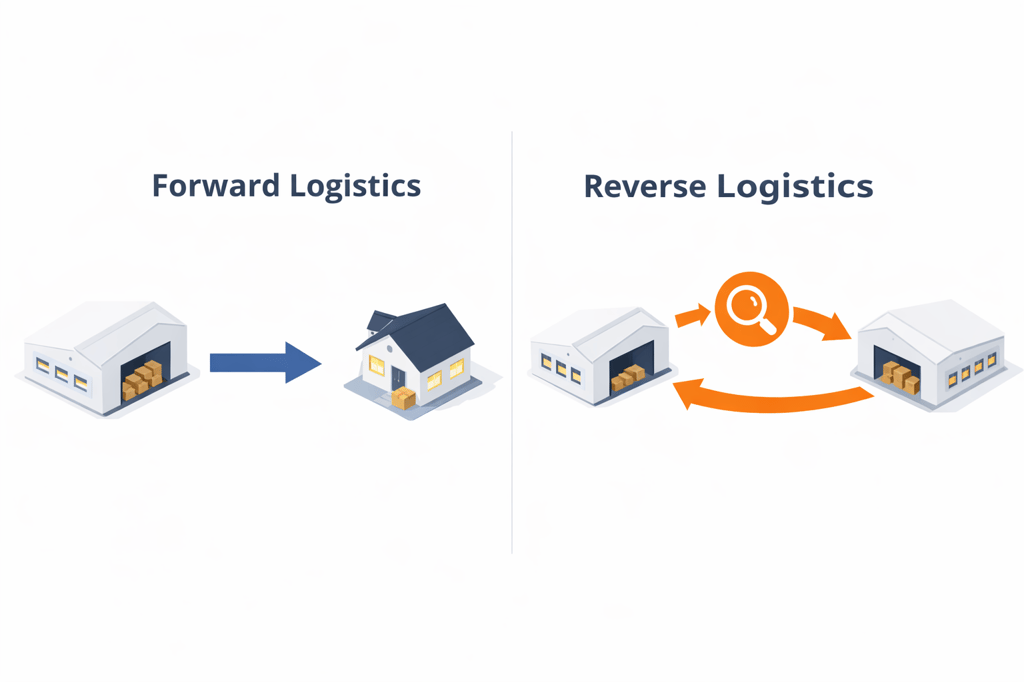
Forward Logistics vs. Reverse Logistics: Why They Need Separate Systems
Understanding the difference between forward and reverse logistics clarifies why your standard fulfillment process cannot simply be run backward. Reverse logistics demands its own dedicated workflows, systems, and expertise.
For brands looking to tighten both directions of their supply chain, understanding how to improve your order fulfillment process is a useful foundation before redesigning the return side.
With reverse logistics explained in contrast to forward logistics, it becomes clear why most brands underinvest in the return direction of their supply chain, until a returns backlog or churn problem forces the conversation.
The table below maps the key operational differences side by side.
| Dimension | Forward Logistics | Reverse Logistics |
| Direction of flow | Warehouse to Customer | Customer to Warehouse |
| Volume predictability | Predictable (order-driven) | Unpredictable (return-driven) |
| Condition of goods | New, uniform | Variable: damaged, opened, unused |
| Routing | Single path (outbound) | Multiple disposition paths |
| Speed expectation | Fast (same-day to 2-day) | Variable (2–8 days inbound) |
| Customer emotion | Positive (order received) | Negative (return frustration) |
| Technology required | WMS, OMS, carrier API | WMS + RMS, inspection tools |
| Cost impact | Revenue-generating | Cost center (if unoptimized) |
| Inventory impact | Stock depleted | Stock potentially restored |
Why reverse logistics is harder than it looks
In practice, reverse logistics works very differently from outbound fulfillment. Those differences compound with scale. Unlike a forward order, which has a predictable SKU, destination, and condition, every return arrives with a different product state, reason, and disposition outcome.
- Variable product conditions: Every return arrives in a different state: unused, opened, damaged, defective, or simply a changed-mind item. There is no single handling path.
- Multiple decision trees: Each returned item requires a separate disposition judgment. One item gets restocked; the next gets refurbished; the next goes to liquidation. This variability makes automation harder than outbound processing.
- Unpredictable volume: Unlike forward orders, you can forecast with historical data, but return volume spikes unexpectedly, especially post-holiday and post-promotion. A big Q4 sale can be followed by 4-6 weeks of elevated inbound returns.
- Carrier complexity: Inbound return shipping is often uncontrolled. Customers use different carriers, pack items incorrectly, or ship without labels, creating receiving exceptions at scale.
- Data gaps: Returns data is scattered across e-commerce platforms, customer service tickets, and carrier systems. Without integrated technology, tracking return reason codes, processing times, and recovery rates requires manual reconciliation.
Processing each return can cost retailers between 20% and 65% of the item’s original value when all operational costs are included, according to Shopify, citing industry data.
Brands that build structured reverse logistics processes recover significantly more product value through restocking and refurbishment. For practical guidance on tightening the process, reviewing how to streamline returns management is a useful first step, since returns quality and outbound quality are closely linked.
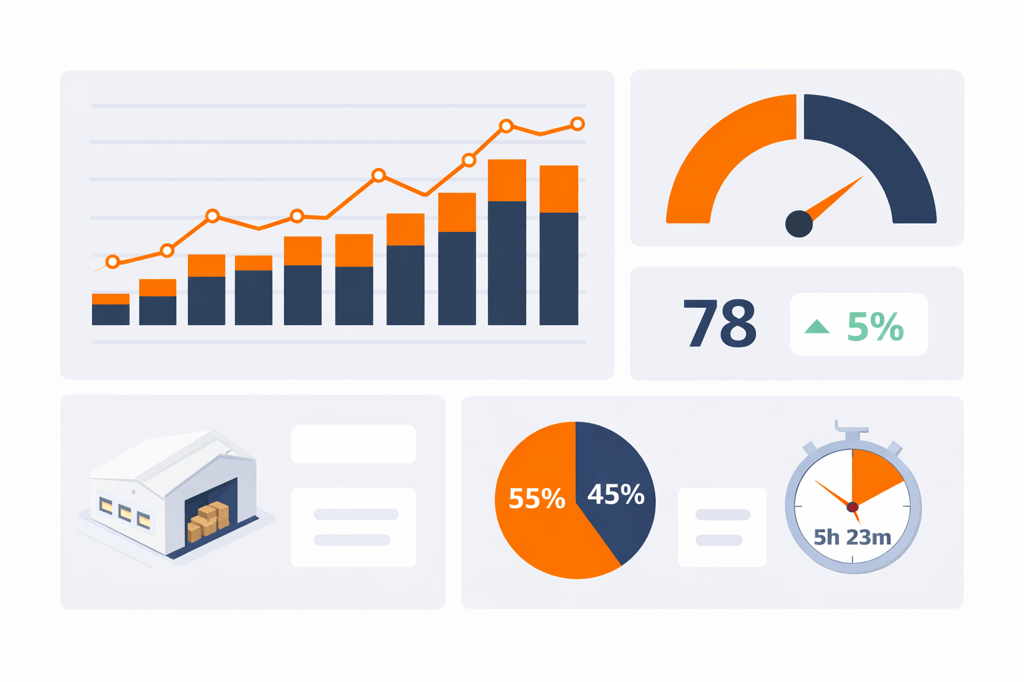
Quick Reference: Returns Management Metrics & Benchmarks
Use these 12 metrics to benchmark your returns operation and identify where value is being lost.
| Metric | Formula | What It Measures | Industry Benchmark | Why It Matters |
| Return Rate | (Units Returned ÷ Units Shipped) × 100 | Baseline reverse logistics volume | ~20% e-commerce avg (industry data 2024); 20–30% apparel; ~9% brick-and-mortar | Tells you how exposed you are to return costs |
| Refund Cycle Time | Days from warehouse receipt to refund issued | How fast the customer experiences resolution | ≤3 days (excellent); 4-5 days (good); >7 days (unacceptable) | 92% of customers will buy again if returns are easy |
| Return-to-Resale Rate | (Units Returned to Saleable Inventory ÷ Total Units Returned) × 100 | % of returns re-entering the forward supply chain | 60-80%+ | Every point below the benchmark = written-off product value |
| Net Recovery Rate | (Revenue from Restocked + Liquidated ÷ Original Sale Value) × 100 | Blended % of original value recovered | 30-55% blended | True ROI metric for your reverse logistics operation |
| Inbound Return Damage Rate | (Units Arriving Damaged ÷ Total Returns Received) × 100 | Share of returns arriving unusable | <15% general; <8% apparel | Points to outbound packaging failures or carrier mishandling |
| Return Reason Code Distribution | Count and % by standardized reason code | Why customers are sending products back | Flag any single reason >25% of volume | Most actionable metric; high concentration traces to a fixable upstream problem |
| Return Label Utilization Rate | (Labels Activated ÷ Labels Issued) × 100 | Share of issued labels actually used | 60-85% | Below 60% suggests policy friction or chargeback resolution |
| Unauthorized Return Rate | (Returns Without Valid RMA ÷ Total Returns) × 100 | Share arriving without authorization | <5% | High rates overwhelm the receiving and indicate portal issues |
| Disposition Decision Accuracy | (Correct Dispositions ÷ Total Returns Audited) × 100 | Consistency of grading and routing | 97%+ | Inconsistent grading leaks margin invisibly |
| Return Processing Backlog Rate | Returns Awaiting Disposition ÷ Avg Daily Volume (in days) | Days of unprocessed returns queued | <2 days (excellent); >5 days (problematic) | Leading indicator of a capacity problem before it becomes a customer problem |
| Cross-Channel Return Routing Accuracy | (Correctly Matched Returns ÷ Total Multi-Channel Returns) × 100 | Accuracy of channel attribution | 99%+ | Misrouted returns cause wrong refund amounts and policy misapplication |
| Return-Driven Restock Lag | Avg days from receipt to available inventory in sales channels | How quickly recovered inventory re-enters the revenue stream | <48 hours (excellent); >5 days (unacceptable) | For high-velocity SKUs, a 5-day lag means avoidable stockouts |
Note: Benchmarks vary by product category, return policy window, and sales channel mix. Build your own historical baseline before comparing externally.
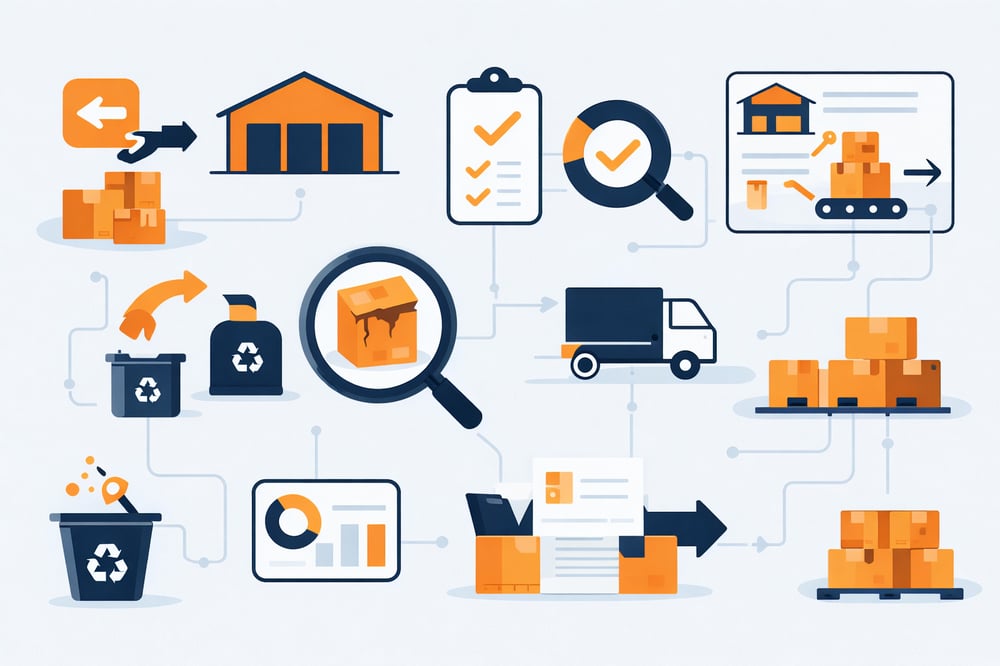
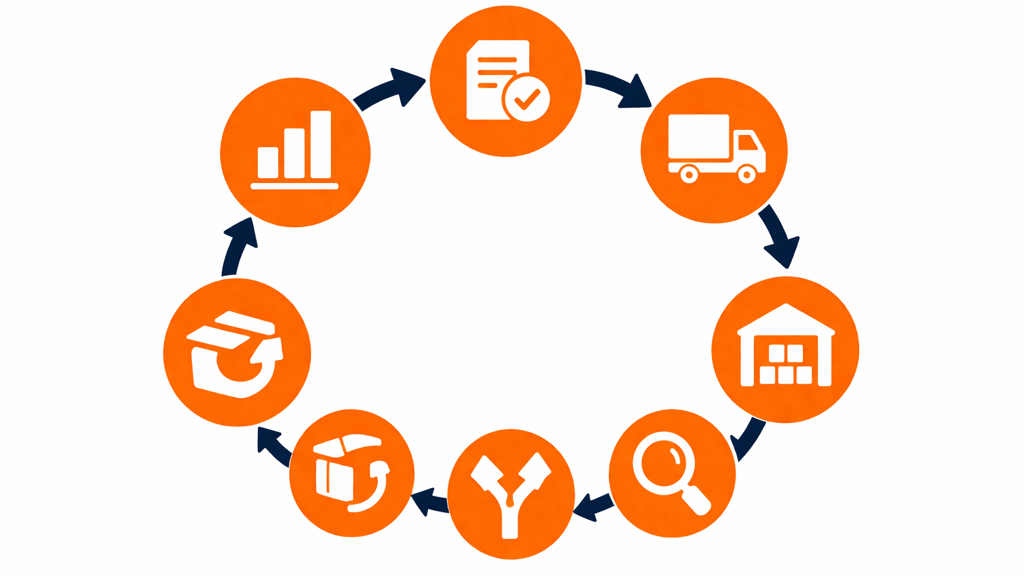
The 7-Stage Reverse Logistics Process: A Complete Operational Breakdown
Effective reverse logistics is a structured, seven-stage process, not a single “receive and restock” action. Each stage requires dedicated workflows, trained staff, and integrated technology to recover maximum value from every return.
Stage 1: Return Authorization & Initiation
The reverse logistics process begins before a return ever ships back. For apparel brands, especially, how returns are handled for apparel fulfillment differs significantly from other categories; category-specific return rates require tailored policies from the authorization step onward.
How a brand handles authorization determines the data it collects and how fast every downstream stage moves.
Return authorization methods:
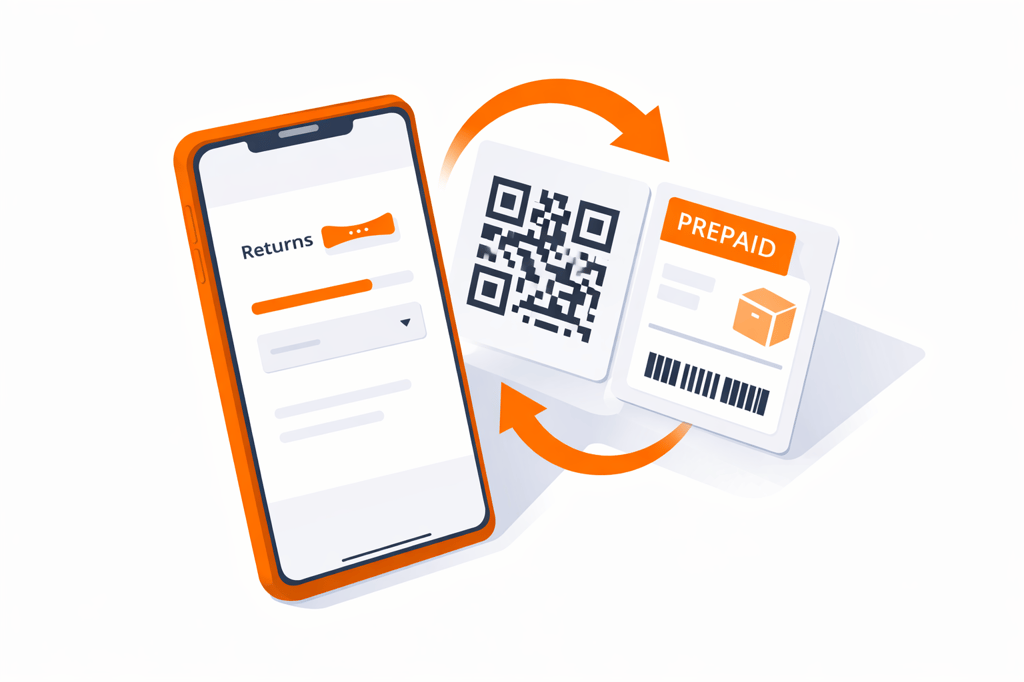
- Self-service portal: Customer initiates via Shopify, Loop Returns, or ReturnLogic; prepaid label generated automatically; reduces support tickets by 30-50%
- Manual RMA: Agent verifies eligibility, creates RMA number, and issues label; higher friction but appropriate for high-value or technical products
- QR code drop-off: Carrier scans at drop-off and generates the label; lowest customer effort, fastest-growing format
Carrier label options:
- Prepaid label in original shipment: lowest friction, higher return rate
- Digital label emailed on request: reduces label waste
- QR code drop-off: no printing required, best for mobile-first customers
Return policy best practices:
- Clear window: 30, 60, or 90-day windows based on product category
- Condition requirements: Unworn, original packaging, tags attached
- Reason codes: 8–12 standardized codes for downstream data use
- Exclusions: Final sale items, personalized goods, opened consumables
Key metrics at this stage:
- Return authorization rate vs. refund request rate
- Average days from refund request to label issued
For DTC brands, understanding how DTC fulfillment returns work at the operational level helps design policies that are customer-friendly without creating unnecessary return volume. The importance of customer service at this stage is often underestimated; authorization friction is where most post-return churn begins.
Stage 2: Return Shipping & Carrier Management
Once authorized, the return enters an inbound shipping phase that many brands have zero control over. Partnering with the right 3PL gives you negotiated return shipping rates, carrier flexibility, and inbound tracking visibility that in-house operations rarely achieve.
The ecommerce returns process works most efficiently when inbound carrier management is treated with the same rigor as the outbound shipping strategy. Most brands negotiate aggressively on outbound rates and ignore inbound entirely, leaving 10-25% in shipping savings on the table.
Inbound carrier options:
- Dedicated return carrier: Volume discounts, better tracking visibility
- Multi-carrier return routing: Flexibility, price optimization by zone
- USPS: Lowest cost for lightweight returns under 1 lb
- UPS/FedEx: Better for fragile or high-value items requiring handling care
Return shipping cost benchmarks:
- Small parcel (<1 lb): $3–$6 inbound
- Standard parcel (1–5 lbs): $6–$12 inbound
- Large parcel (5–10 lbs): $12–$20 inbound
Best practices for carrier management:
- Negotiate inbound return rates as part of your outbound carrier contract
- Use dimensional weight optimization on return packaging
- Implement return tracking visibility so receiving teams can prepare before arrival
- Require Advanced Shipment Notices (ASNs) so the warehouse knows what is coming
Applying the same principles used to improve outbound shipping efficiency to inbound return flows reduces per-return cost significantly. Pairing strong return carrier management with 2-day outbound fulfillment creates a complete end-to-end customer experience that drives repeat purchase.
Stage 3: Receiving & Intake at the Fulfillment Center
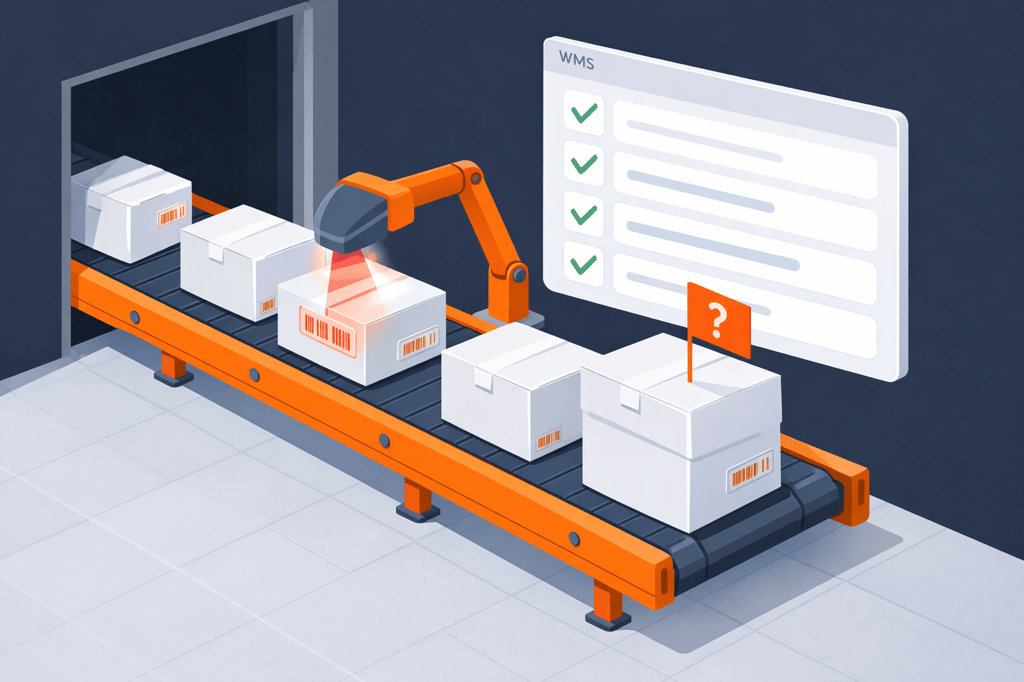
Physical receiving is where reverse logistics breaks down for most brands operating in-house. Poor dock scheduling at the fulfillment center level means inbound return shipments end up competing with inbound inventory for receiving capacity before anyone notices the bottleneck. Items arrive without labels, in the wrong boxes, or damaged.
Without a structured intake protocol, they become an untracked inventory liability.
Intake workflow:
- Scan the inbound carrier label against the RMA system
- Log return receipt in WMS (timestamp, weight, condition flag)
- Match against open RMA; flag unmatched returns for investigation
- Route to inspection zone, segregated from forward inventory
- Update customer record; trigger refund or exchange if policy-based
Common intake problems and solutions:
- No RMA match: Items arriving without authorization; create an “exception” queue and contact the customer
- Incorrect items returned: Document, photograph, and flag for customer communication
- Damaged outer packaging: Photo-document before opening to support carrier claims
- Multiple units in one return: Verify each unit individually against the RMA
Intake target metrics:
- Dock-to-system time: <24 hours
- Receiving accuracy: 99%+
- Unmatched return rate: <3%
Connecting intake to your broader inventory fulfillment operation ensures returned stock flows back into available inventory without manual reconciliation delays.
Stage 4: Inspection & Grading
Inspection is the most labor-intensive and judgment-intensive stage of reverse logistics. At high volumes, pick and pack fulfillment services from a 3PL include dedicated inspection staff who apply consistent grading standards, unlike in-house operations, where inspection is often assigned to whoever is available.
A systematic grading protocol, consistently applied, is the difference between recovering 70% of the return value and recovering 20%.
Visual inspection checklist:
- Outer packaging condition: new, damaged, missing
- Product condition: sealed, opened, used, damaged
- Completeness check: all components, accessories, and documentation present
- Manufacturing defect vs. customer damage assessment
Functional testing (where applicable):
- Electronics: Power-on test, basic functionality check
- Apparel: Stain, tear, and odor check
- Health/supplement products: Seal integrity and expiration date
- Fragile goods: Structural integrity assessment
Industry-standard grading scale:
Each returned item is assigned one of four grades, which determines its disposition path.
| Grade | Condition | Disposition Path |
| A – Like New | Unopened or opened with no visible use signs | Primary resale |
| B – Good | Minor signs of use, fully functional, may need repackaging | Refurbish/repackage |
| C – Fair | Visible use or wear, still functional | Secondary market |
| D -Damaged/Defective | Not resalable in the primary channel | Refurbishment or liquidation |
Documentation requirements:
- Photograph each return before and after inspection
- Record defect type against the reason code
- Note the condition grade in WMS
- Flag potential warranty or quality issues for brand notification
Inspection metrics to track:
- Inspection throughput: Units graded per labor hour
- Grading accuracy: Verified by QC re-check of 5–10% of decisions
Grading consistency is also where value-added services from a capable 3PL, like repackaging, relabeling, and refurbishment, deliver direct margin recovery.
Stage 5: Disposition Decision
After grading, every returned item requires a disposition decision, the most strategically important choice in the entire reverse logistics process.
Returned inventory sitting in limbo without a clear disposition path contributes directly to warehouse shrinkage, a cost that compounds the longer a decision is delayed. Poor disposition decisions erode margin; smart ones recover value that would otherwise be written off.
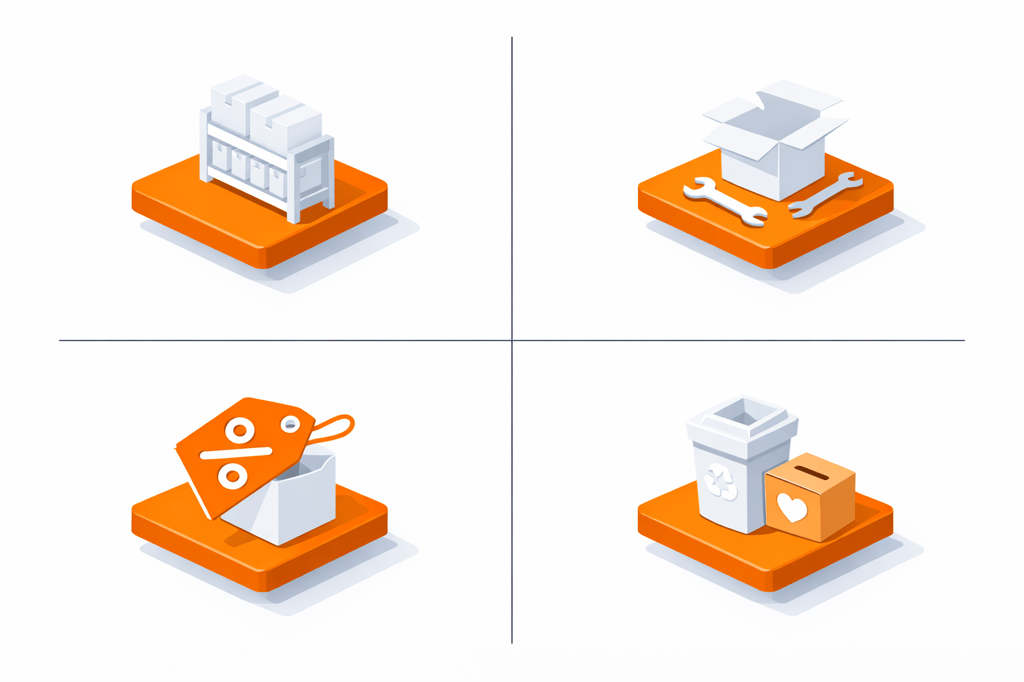
The 5 disposition options:
- Restock to Primary Inventory: Grade A items meeting all brand standards; fastest path back to revenue
- Refurbish & Repackage: Grade B items requiring cleaning, repackaging, or minor repair before resale
- Secondary Market/Liquidation: Grade C items sold through discount channels or wholesale buyers
- Donate: Apparel, food, and consumer goods that don’t meet resale standards but are usable
- Dispose/Destroy: Defective, unsafe, or regulatory non-compliant items; must be documented
Disposition decision matrix:
Use this matrix to route each item to the right path based on its condition grade and expected recovery rate.
| Condition Grade | Recommended Disposition | Recovery Rate |
| A – Like New | Restock primary | 90–100% |
| B – Good | Refurbish/repackage | 60–80% |
| C – Fair | Secondary market | 10–40% |
| D – Damaged | Dispose/donate | 0–10% |
Use the inventory shrinkage calculator to quantify what poor disposition practices cost your operation annually.
Stage 6: Restocking, Refurbishment & Repackaging
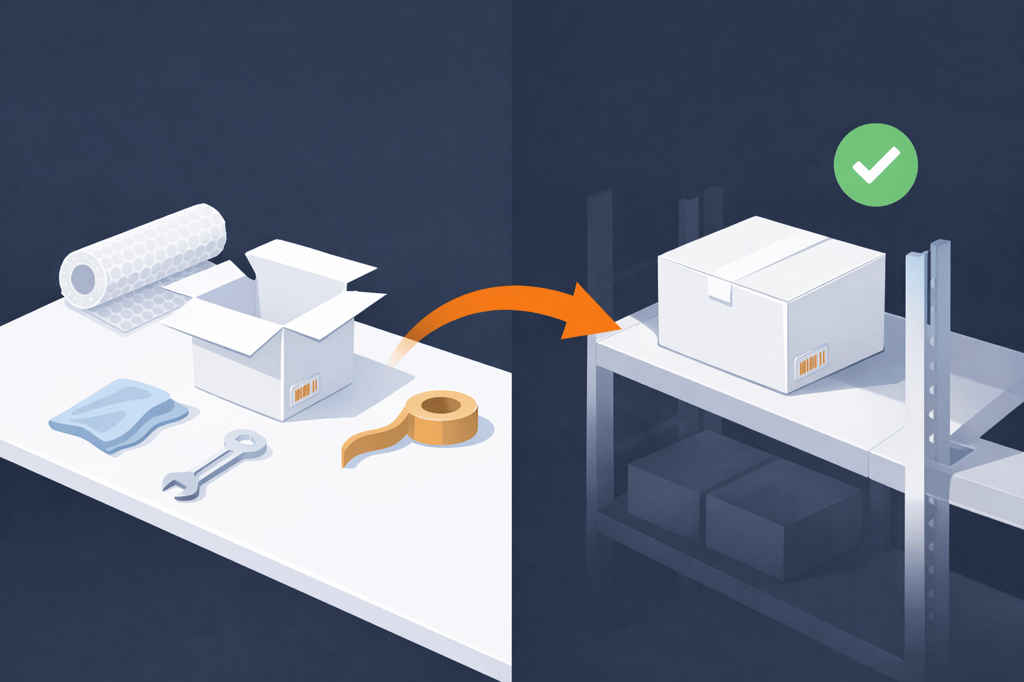
Disposition decision made, the item either flows back into forward inventory or exits through an alternative channel. The speed of this stage directly determines how quickly recovered inventory generates revenue and how accurately your stock levels reflect reality.
Grade A – immediate restock workflow:
- Update WMS inventory count in real time
- Return to the original bin location or the designated return-stock location
- Sync inventory count back to all connected sales channels
- Target: Restock within 24-48 hours of disposition decision
Use the inventory turnover calculator after each cycle to validate whether recovered inventory is moving at the expected rate; if it’s lagging behind primary inventory turnover, it signals a grading or restocking location issue worth investigating.
Grade B – refurbishment workflow:
- Move to a dedicated refurbishment station
- Clean, repair, or repackage per brand standards
- Re-inspect to confirm Grade A after refurbishment
- Restock or transfer to the secondary channel
- Track refurbishment labor cost per unit for reporting
Liquidation coordination:
- Batch Grade C inventory weekly or monthly
- Submit to approved liquidation partners (B-Stock, Direct Liquidation, wholesale buyers)
- Document recovery amount per unit for monthly reporting
Inventory accuracy rules at this stage:
- Update WMS the moment items enter or exit inventory
- Never leave returned items in “pending” status for more than 48 hours
- Conduct spot-checks on restocked return inventory weekly
For brands asking whether a 3PL can genuinely handle this complexity, reviewing how a 3PL provider helps with inventory management answers the question with operational specifics.
Stage 7: Reporting & Root Cause Analysis
Stage 7 is where returns management moves from operational function to strategic advantage. Knowing which 3PL KPIs to track, including return processing time and inventory accuracy, gives you the right framework before diving into the data this stage generates.
Return rate, return processing time, and restocking accuracy belong in any serious fulfillment scorecard. Our complete breakdown of the fulfillment KPIs that matter covers the twelve metrics we’d grade any 3PL against.
Return reasons, grades, disposition outcomes, and processing times feed root cause analysis that reduces future return rates and improves product quality.
Essential returns reports by cadence:
The reporting schedule below keeps your team ahead of issues rather than reacting to them.
| Cadence | Report Content |
| Daily | Units received, processed, and dispositioned; processing time per return; exception queue |
| Weekly | Return rate by SKU and category; disposition outcome distribution; refund cycle time |
| Monthly | Return rate trends vs. prior period; value recovered vs. written off; top return reasons; carrier damage analysis |
Root cause analysis framework:
- High return rate on specific SKU: Investigate product description accuracy, sizing guides, photography, and quality control
- High damage rate on inbound returns: Investigate outbound packaging quality, carrier handling, and product fragility
- Low restock rate: Investigate inspection standards, refurbishment capacity, and grading consistency
- Slow refund cycle time: Investigate receiving bottlenecks, WMS delays, and staffing levels
Use the fulfillment cost calculator to model what improving returns processing speed and recovery rates means for total fulfillment economics.
The 4 Disposition Strategies: Recovering Maximum Value from Every Return
Disposition strategy is not one-size-fits-all. The right choice for each returned item depends on product category, condition grade, brand positioning, and margin structure.
Choosing the wrong path, restocking what should be liquidated, or disposing of what could be refurbished, is where most of the invisible margin loss in reverse logistics actually happens.
Strategy 1: Restock to Primary Inventory
Restocking is the highest-value disposition outcome. A Grade A item returned to saleable inventory recovers 90–100% of its original product value, making it the clear first choice whenever the condition supports it.
When to use: Grade A items that meet all brand quality standards after inspection.
Best for: Products with high resale value, stable demand, and no shelf-life constraints, including electronics accessories, hard goods, unopened consumables, and new-condition apparel.
Operational requirements:
- Consistent, documented grading rubric applied at inspection
- Repackaging station for opened-but-unused items (new polybag, inserts, labels)
- Real-time WMS sync to all connected sales channels upon restocking
- Target: Item available for sale within 24–48 hours of disposition decision
Key risk to manage:
Restocking a compromised item damages customer trust and generates a secondary return. Never restock without documented inspection and photo evidence. A 1% error rate on restocked returns creates a disproportionate return-of-returns problem that compounds quickly at scale.
Strategy 2: Refurbishment & Repackaging
Refurbishment is the most underused strategy in e-commerce returns. Most brands skip straight to liquidation for anything less than Grade A, leaving 20–40 percentage points of recoverable value on the table.
When to use: Grade B items with minor cosmetic issues, missing inserts, surface marks, or light wear that don’t affect function or customer experience.
Best for: Electronics, accessories, apparel that can be cleaned or repackaged, and any product where refurbishment cost is lower than the gap between liquidation proceeds and replacement cost.
Operational requirements:
- Dedicated refurbishment station, separate from standard picking and packing
- Product-specific cleaning, repair, and repackaging protocols documented per SKU category
- Labor cost tracking per unit to validate refurbishment economics each cycle
- Re-inspection after refurbishment to confirm Grade A before restocking
Recovery benchmark: Refurbishment typically recovers 60-80% of original product value versus 10-40% through liquidation. Run the numbers using the cost per unit calculator before defaulting to liquidation; the math often favors refurbishment for items in the 50–70% condition range.
Strategy 3: Secondary Market & Liquidation
Liquidation is the right path when an item cannot be economically restored to primary channel standards, but still carries partial resale value in alternative markets.
When to use: Grade C items that cannot be restocked or refurbished cost-effectively to primary channel standards.
Best for: Fashion items with style obsolescence, electronics with minor functional issues, seasonal products past peak selling windows, and items where refurbishment cost exceeds liquidation recovery.
The single biggest stress on a returns program is the January surge that follows Q4 — design choices made in October determine whether you spend the new year clearing backlogs or recapturing margin. Our peak season fulfillment guide walks through how to plan the reverse-logistics surge before it lands.
Liquidation channels to consider:
- B-Stock: Branded liquidation marketplace, business buyers
- Direct Liquidation: Bulk lots, returns pallets
- Wholesale buyers: Category-specific buyers who resell through outlet or discount channels
- Brand-authorized secondary sellers: Controlled off-price distribution that protects positioning
What to expect: Liquidation typically recovers 10-40 cents on the dollar, depending on product category, condition, and buyer demand. It is a floor, not a target. Use it only after confirming refurbishment is not economically viable for that item or lot.
Strategy 4: Donation & Disposal
Donation and disposal are the end-of-value paths for Grade D items. Neither generates revenue, but both carry meaningful operational and financial implications that brands often overlook.
For luxury or high-equity products, premium fulfillment services provide controlled destruction with documented chain-of-custody processes that meet brand standards and satisfy legal record-keeping requirements.
When to use: Grade D items with no viable resale path through primary or secondary channels.
Donation approach:
- Apparel, food, and consumer goods in usable condition can be coordinated through local charities or platforms like Good360
- Document all donations properly for tax purposes; donation programs generate meaningful tax benefits that partially offset write-off losses for high-volume brands
- Track donation volume per cycle as part of your net recovery reporting
Disposal and destruction:
- Required for safety-recall items, expired supplements, counterfeit goods, or regulatory non-compliant products
- Document the chain of custody and destruction method with signed records
- For brands in regulated categories (supplements, electronics, medical devices), compliance documentation is non-negotiable
Brand protection note: For luxury and high-brand-equity products, controlled destruction is often preferred over liquidation to protect brand positioning and avoid unauthorized secondary market exposure.
Returns Management by Sales Channel: Shopify, Amazon, & Multi-Channel
Returns management requirements differ significantly by sales channel. What works for a Shopify DTC brand rarely maps to Amazon’s policy-driven return environment. Omnichannel operations require a unified approach that handles all channels simultaneously.
Shopify Returns
Shopify gives brands full control over return policy design and the customer experience. One of the most common questions brands ask is whether a 3PL can integrate directly with Shopify; the answer is yes. Purpose-built integrations eliminate the manual handoffs that slow return processing, making this an advantage that requires intentional setup to fully leverage.
The Shopify returns landscape:
- Return portals are natively available (Shopify Returns, Loop Returns, AfterShip)
- Direct integration with Fulfyld WMS enables automated return routing
- Custom-branded return experience from label generation to receipt confirmation
- Full control over policy windows, reason codes, and refund/exchange logic
Best practices for Shopify returns:
- Install a dedicated returns portal for self-service (reduces support tickets by 30–50%)
- Capture reason codes at initiation for downstream reporting
- Configure automatic refund or exchange triggers based on condition, integrated with your 3PL
- Set policy windows appropriate to the product category, not one-size-fits-all
When Shopify connects to Fulfyld’s WMS, return receipts automatically trigger inventory updates and refund notifications, no manual reconciliation required. Shopify fulfillment services include native return routing built into the fulfillment workflow.
Amazon Returns
Amazon’s return environment is fundamentally different from DTC, and largely outside the seller’s control. For FBM sellers, Amazon SFP and FBA prep services include return handling built directly into the workflow, a critical detail before routing FBM returns through a 3PL.
Understanding how it works is essential before setting up any returns operation for Amazon channels.
The Amazon returns environment:
- Amazon controls the return policy (A-to-Z Guarantee); most items can be returned within 30 days without seller approval
- FBA returns: Amazon processes at its fulfillment center and charges a returns processing fee
- FBM returns: The seller manages returns directly; a 3PL receives and processes on the seller’s behalf
Key considerations for Amazon sellers:
- FBA “unfulfillable” inventory: Items Amazon deems unsaleable are returned to the seller or liquidated (stranded inventory risk)
- Removal orders: Retrieve FBA inventory before long-term storage fees accumulate
- FBM return routing: Direct returns to your 3PL for processing, not a home or office address
Pairing Amazon return management with D2C fulfillment services under one 3PL roof eliminates the inventory fragmentation that occurs when channel returns are handled separately.
WooCommerce & Multi-Channel Returns
Multi-channel operations face the highest returns management complexity: multiple policies, multiple platforms, and constant risk of inventory fragmentation if returns aren’t centralized.
Fulfyld’s integrations library covers WooCommerce, BigCommerce, Etsy, Walmart Marketplace, and eBay, all routing returns to a single processing point, so none of those channels require separate reverse logistics handling.
The multi-channel challenge:
- Each platform has different return windows, policies, and customer expectations
- WooCommerce provides full seller control, similar to Shopify, but requires manual or plugin-based return management
- Without centralized routing, returned inventory can end up credited to the wrong channel
Centralized returns strategy:
- Route all returns, regardless of origin channel, to a single 3PL receiving point
- Use a centralized OMS to match inbound returns to the original channel order
- Disposition decisions and inventory updates reflect across all channels simultaneously
- Customer communication is handled through channel-specific workflows; logistics are unified
Omnichannel e-commerce fulfillment solves the multi-channel returns complexity by treating all channels as one logistics operation.
Technology Stack for Reverse Logistics: What You Need and Why
Efficient reverse logistics runs on integrated technology. A capable 3PL warehouse management system sits at the core of any returns operation; without it, your team spends more time manually reconciling returns than processing them.
Without the right systems connecting your return portal, OMS, WMS, and carrier network, the entire chain breaks down.
Core technology layers
Four interconnected layers power every returns operation, each one feeding directly into the next.
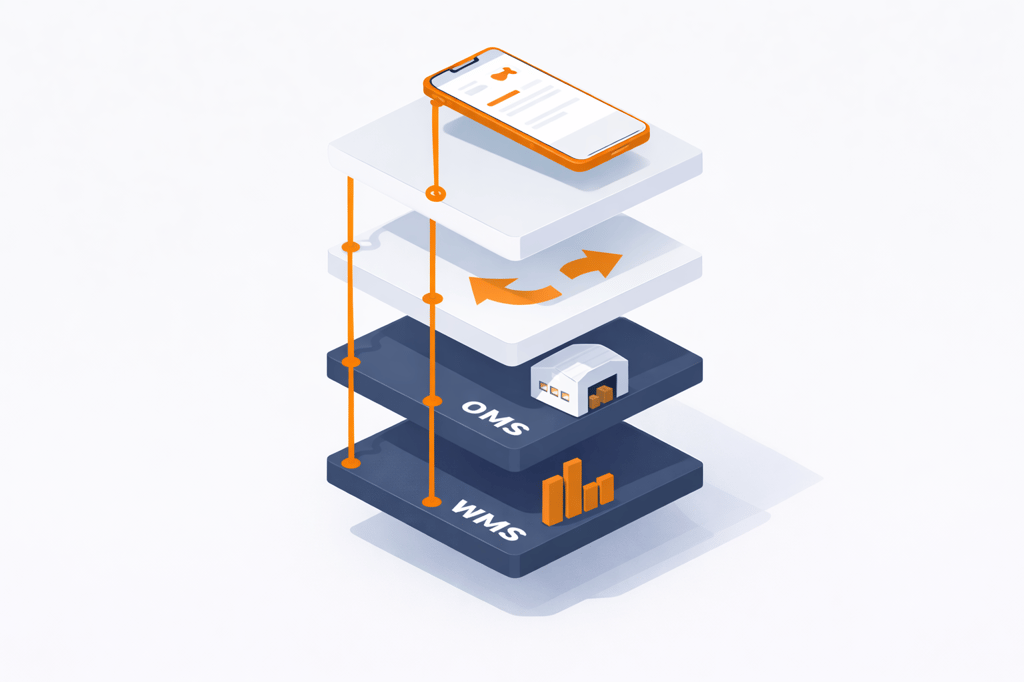
Layer 1: Customer-facing returns portal
The platform you choose here shapes the entire customer return experience. Here are the leading options and what each does best.
| Platform | Best For | Key Features |
| Loop Returns | Shopify DTC brands | Exchange-first workflow, branded experience |
| AfterShip Returns | Multi-channel brands | Multi-carrier, branded portal, analytics |
| Narvar | Mid-market to enterprise | Advanced tracking, predictive routing |
| ReturnLogic | Complex return workflows | Deep analytics, reason code segmentation |
| Native Shopify Returns | Early-stage brands | Basic management, no additional cost |
Layer 2: Order & Return Management System (OMS/RMS)
- Matches return to the original order across all channels
- Triggers refund, exchange, or store credit based on policy rules
- Routes return to the correct fulfillment center
- Provides status updates to the customer throughout the process
Layer 3: Warehouse Management System (WMS)
- Logs inbound returns against RMA
- Manages inspection workflow and grading assignments
- Routes disposition instructions to the receiving team
- Updates inventory counts in real time upon restocking
Layer 4: Reporting & analytics
- Return rate by SKU, channel, and reason code
- Processing time analytics
- Disposition outcome reporting
- Net recovery rate tracking
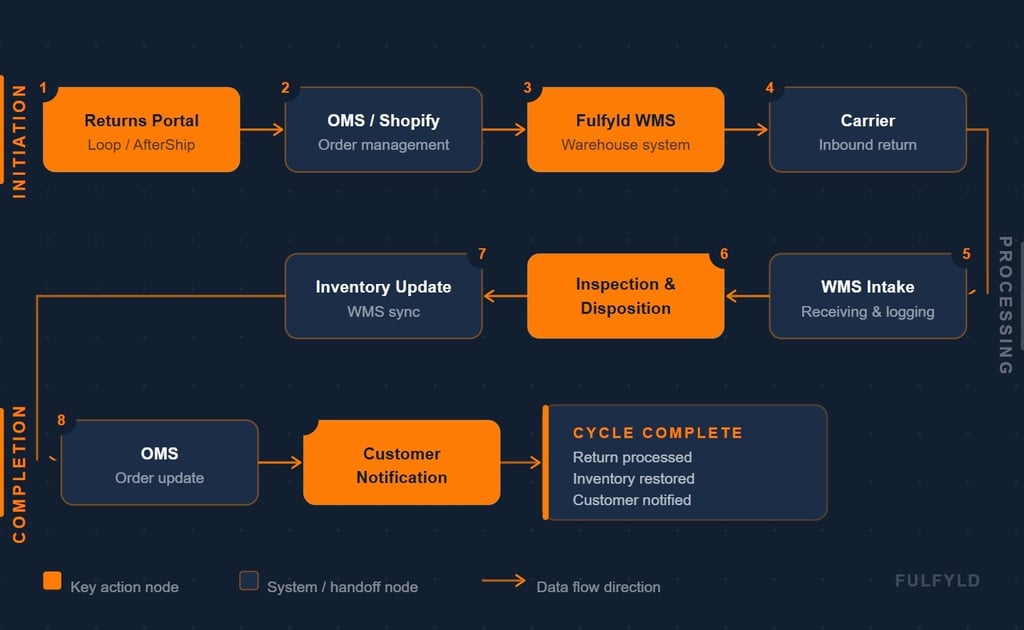
Technology integration architecture
The ideal returns tech stack flows as follows:
Returns Portal (Loop/AfterShip) > OMS/Shopify > Fulfyld WMS > Carrier (inbound)
> WMS Intake > Inspection & Disposition > Inventory Update > OMS > Customer Notification
Integration requirements:
- Bidirectional sync between the returns portal and WMS
- Real-time inventory updates from WMS to all sales channels
- Carrier tracking feeds into the returns portal for customer-facing visibility
- Return reason data flows into the analytics dashboard for monthly reporting
Technology red flags, signs your returns stack is failing:
- Manual CSV uploads between any two systems in your returns flow
- Inventory counts don’t reflect restocked returns for days or weeks
- Customers have no visibility into the return status after shipping
- Return reason data is not captured or accessible for analysis
3PL automation handles the inventory update and customer notification layers without manual intervention once the integration is configured. For Shopify brands specifically, the Shopify integration connects the returns portal to Fulfyld’s WMS directly.
In-House vs. 3PL Returns Management: A True Cost & Capability Comparison
For brands processing fewer than 200 returns per month, in-house management may be manageable. Beyond that threshold, or for any brand with complex product categories, multi-channel operations, or rapid growth, the case for outsourcing to a capable 3PL becomes compelling.
Cost comparison
Here is how the real costs of in-house returns stack up against outsourcing to a 3PL across every major expense line.
| Cost Component | In-House Returns | 3PL Returns |
| Labor (receiving, inspection, restocking) | $18-$25/hr × 1–3 FTEs = $3K–$7K/month | Included in the per-return or monthly service fee |
| WMS/RMS software | $200-$800/month | Included with 3PL WMS |
| Dedicated returns processing space | Estimate $500-$2K/month of warehouse lease | Included in storage rate |
| Returns shipping costs | Self-negotiated (no volume leverage) | Negotiated rates (10-25% savings) |
| Equipment (scanners, workstations) | $3K-$10K upfront | Provided by 3PL |
| Per-return processing cost (all-in) | 20%-65% of the item’s original value (Shopify); industry average $20–$30 per unit across all cost components | 3PL per-return fees typically $2-$10 for inspection/restocking; lower overall due to shared infrastructure |
| Scalability during return spikes | Requires emergency hiring or overtime | Absorbed by 3PL capacity |
The numbers above tell one part of the story. The real advantage of a 3PL, however, goes beyond cost: it’s the operational capability gap that widens as return volume grows. The table below shows where that gap is most significant.
Capability comparison
| Capability | In-House | 3PL Partner |
| Grading & inspection expertise | Low unless specifically trained | High; established protocols |
| Refurbishment capacity | Limited | Available as a value-added service |
| Multi-channel routing | Complex to manage | Centralized, automated |
| Real-time inventory updates | Depends on WMS quality | Enterprise WMS standard |
| Carrier negotiations (inbound) | Limited leverage | Volume-based negotiated rates |
| Returns analytics & reporting | Manual or basic | Automated dashboards |
| Peak season capacity | Constrained | Scalable on demand |
| Cross-border returns | Significant complexity | Experienced, established process |
When to keep returns in-house
- Monthly return volume under 150–200 units
- Highly specialized products requiring proprietary inspection knowledge
- A business model where personal customer interaction on returns drives retention
- Very high margin, low-volume luxury goods requiring white-glove handling
When to outsource returns to a 3PL
- Return volume exceeding 200 units per month
- Multi-channel operations with returns from 2+ platforms
- A growing brand where returns are consuming disproportionate internal time
- High return rates (>20%) are creating warehouse bottlenecks
- Seasonal spikes (post-holiday) overwhelm in-house capacity
- Need for faster refund cycles to protect customer retention
For brands on the fence about the economics, is outsourcing fulfillment to a 3PL more cost-effective? breaks down the variable vs. fixed cost comparison in detail. Reviewing Fulfyld’s 3PL pricing gives a concrete starting point for modeling the per-return cost against your current in-house spend.
Before selecting a partner, using a structured 3PL comparison framework ensures you evaluate returns-specific capability, not just outbound fulfillment.
How to Evaluate a 3PL for Returns Management: A Practical Framework
Not all 3PLs are built for returns. Many treat reverse logistics as a secondary service bolted onto their outbound fulfillment operation. The Sonia Roselli Beauty partnership case study is a strong example of what a long-term 3PL relationship that handles returns with the same precision as outbound fulfillment actually looks like.
Use this framework to separate returns-capable partners from generic providers.
Returns-specific evaluation checklist
Operational capabilities:
- Dedicated returns receiving area (physically separate from inbound inventory)
- Documented inspection and grading protocol (ask to see it)
- Refurbishment and repackaging capability on-site
- Average return processing time: ask for documented rate (target: 2–5 days)
- Disposition flexibility: restock, refurbish, liquidate, donate, destroy
- Return lot/batch tracking for regulatory compliance (supplements, electronics)
Technology & integration:
- Native WMS support for returns workflows (not a workaround)
- Integration with your returns portal (Loop, AfterShip, Narvar, or native Shopify)
- Real-time inventory updates upon return disposition
- Returns reporting dashboard with SKU-level data
- Automated customer notification triggers
Performance standards:
- Return processing SLA: What is the committed window?
- Restocking accuracy: 99%+ target
- Return processing cost transparency: Per-unit pricing, no hidden fees
- Peak season capacity: Can they handle a post-holiday return surge?
Communication & partnership:
- Dedicated account manager (not just a ticket queue)
- Regular reporting on return rate, processing time, and recovery rates
- Proactive flagging of product quality issues from return data
- Willingness to share historical returns performance data from similar accounts
Red flags to watch
- Returns handled by the same team as inbound receiving, with no dedicated workflow
- No documented inspection grading protocol; subjective decisions lead to inconsistent outcomes
- Inability to separate return inventory from forward inventory during processing
- Processing times longer than 7 business days are standard
- No real-time WMS access for your team
- Inability to integrate with your current returns portal
- “We handle it on a case-by-case basis” means there is no system
Questions to ask in 3PL evaluation calls
- What is your average return processing time from receipt to disposition?
- How do you handle items that arrive without an RMA?
- Can you provide an example of your inspection grading rubric?
- What disposition options do you support beyond restock?
- How does your WMS update our inventory channels after a return is processed?
- What are your busiest return periods, and how do you scale for them?
- Do you provide SKU-level return rate reporting?
A dedicated account management model matters more for returns than for any other fulfillment function. Returns problems escalate quickly, and you need a contact who knows your product and policies, not a generic ticket queue.
Understanding what 3PL responsibilities actually include for returns helps brands set contractual expectations clearly. Reviewing 3PL pricing models before signing ensures per-return fees, inspection fees, and peak season surcharges are all scoped in.
Common Returns Management Mistakes: What They Cost and How to Fix Them
Most returns management failures are predictable and preventable. These are the six mistakes that consistently cost e-commerce brands margin, inventory accuracy, and customer retention.
Mistake 1: No standardized inspection protocol
Without consistent grading standards, two warehouse workers make different disposition decisions on identical returned items. One restocks; one disposes. This creates margin leakage and inventory inaccuracy simultaneously.
Prevention:
- Document a written inspection and grading rubric for every product category
- Photograph all returns during inspection, before and after
- Train inspection staff with side-by-side condition examples (visual reference guides)
- Audit a 10% sample of grading decisions weekly against the rubric
Mistake 2: Processing returns in the same flow as forward inventory
Returns mixed into the standard receiving workflow slow both processes, contaminate forward inventory with unverified stock, and make return tracking nearly impossible. Receiving teams are optimized for inbound purchase orders, not variable-condition returns.
Prevention:
- Dedicate a physical returns processing zone, separate from inbound receiving
- Assign specific staff shifts or roles to returns only during peak return periods
- Never move returned items into saleable inventory locations until inspection and disposition are complete
Mistake 3: Delaying refunds until the item is restocked
Customers expect refunds within 3–5 business days of return shipment; as the Daily Grind Planner customer service case study demonstrates, fast, proactive post-return communication directly drives repeat purchase rates.
Brands that tie refunds to the full inspection-and-restock cycle can take 2-3 weeks, driving chargebacks, negative reviews, and permanent churn.
Prevention:
- Decouple refund processing from restocking (issue a refund upon receipt and inspection, not after restocking)
- Configure your OMS to trigger refunds at the “received and inspected” stage
- Track refund cycle time as a core KPI; target ≤3 business days from receipt
Mistake 4: Not capturing return reason codes
Brands that process returns without capturing why items are coming back miss the most valuable data point in their supply chain. Without reason code data, there is no path to return rate reduction.
Prevention:
- Require reason code selection at the customer initiation step (portal or support)
- Map warehouse inspection findings to reason codes; customer-reported vs. warehouse-confirmed defect
- Review reason code reports monthly and flag any single reason representing >20% of volume
- Share reason code data with product development, marketing, and sourcing teams quarterly
Mistake 5: Ignoring the post-return customer experience
A smooth return process is not enough on its own. Brands that process returns quickly but communicate poorly, with no status updates or resolution confirmation, lose customers even when the return itself went fine. Silence after a return is interpreted as negligence.
Prevention:
- Automated status emails at each stage: return received, return inspected, refund/exchange issued
- Personalized follow-up after resolution (survey, discount offer, product recommendation)
- Customer satisfaction score tracking specifically for the post-return experience
Mistake 6: Not using returns data to reduce returns
Returns are treated as an operational cost to manage, not an intelligence source to act on. Brands with persistently high return rates on specific SKUs rarely trace the issue back to product or listing problems until financial damage is already significant.
Prevention:
- Conduct a monthly SKU-level return rate review; flag any SKU with a rate >25%
- Share return reason data with product development, marketing, and sourcing teams
- A/B test product descriptions, sizing guides, and photography for high-return SKUs
- Track whether listing changes correlate with return rate changes over a 60–90 day window
Build a Returns Operation That Protects Margin and Retains Customers
Returns management is not a back-office problem. It’s a direct lever on customer lifetime value, inventory health, and profit margin.
Brands that build structured, data-driven reverse logistics processes recover more inventory value, process faster refunds, and retain more customers than those treating returns as an afterthought.
The 7-stage process outlined here, paired with the right technology stack and the right 3PL partner, turns your returns operation from a liability into a recoverable margin line.
Ready to partner with a 3PL that treats your reverse logistics with the same precision as your forward fulfillment?
Get Started with Fulfyld | Request a Free Quote
Contact Our Team | Explore Fulfyld Services
Set Up Your Amazon Integration
Frequently Asked Questions
What is reverse logistics in 3PL and fulfillment?
Reverse logistics in a 3PL context refers to the process of receiving, inspecting, and disposing of products that flow back from customers to the fulfillment center.
In e-commerce, this covers everything from inbound return shipping and warehouse intake to inspection grading, inventory restocking, and refund processing, all managed on behalf of the brand.
How does reverse logistics work?
A customer initiates a return, receives a prepaid label, and ships the item back to the fulfillment center. The 3PL logs the item upon arrival, inspects and grades it, makes a disposition decision (restock, refurbish, liquidate, or dispose), updates inventory accordingly, and triggers a refund or exchange. The full cycle typically runs 2–5 business days at a well-run 3PL.
How can a 3PL help manage e-commerce returns efficiently?
A 3PL provides dedicated returns processing space, trained inspection staff, integrated WMS technology, and established carrier partnerships that most brands can’t replicate in-house at competitive cost. The result is faster refund cycles, higher inventory recovery rates, and real-time returns data, without diverting internal team resources away from growth.
Why is returns management important for brands?
Returns directly affect customer retention, inventory accuracy, and profit margins. Research consistently shows that 92% of consumers will buy again from a retailer if the return process is straightforward.
Poorly handled returns generate chargebacks, negative reviews, and permanent customer churn. 71% of consumers say a bad return experience would stop them from buying from that brand again (NRF).
What are the costs of handling returns in-house vs. outsourcing to a fulfillment partner?
Returns management in-house typically costs 20%–65% of the item’s original value per return, factoring in labor, shipping, inspection, and storage. Industry estimates place the average per-unit cost at $20-$30.
Outsourcing to a 3PL replaces those fixed costs with a transparent per-return fee, adds negotiated inbound carrier rates, and eliminates capital investment. For brands processing 200+ returns monthly, outsourcing is generally more cost-effective.
What are the main steps in reverse logistics?
The seven core steps are: return authorization and initiation, inbound return shipping, warehouse receiving and intake, inspection and grading, disposition decision, restocking or refurbishment, and reporting with root cause analysis. Each step requires dedicated workflows; they cannot be handled as informal add-ons to forward fulfillment operations.
How do fulfillment centers process returns from multiple sales channels?
All returns, regardless of origin channel (Shopify, Amazon, WooCommerce, Etsy), are routed to a single 3PL receiving point. The WMS matches each return to its originating order across channels, applies channel-specific policies, and updates inventory across all connected platforms simultaneously.
This centralized approach eliminates the fragmentation that occurs when brands handle channel returns separately.
What technology do 3PLs use to track and process returns?
Returns-capable 3PLs use a combination of a Warehouse Management System (WMS) for intake and inventory tracking, integration with customer-facing returns portals (Loop, AfterShip, Narvar), OMS connectivity for refund triggering, and carrier API integrations for inbound tracking.
Best-in-class operations also include returns analytics dashboards that report by SKU, reason code, and disposition outcome.
What is the average turnaround time for returns in a 3PL warehouse?
At a well-operated 3PL, the target turnaround from receipt to completed disposition is 2-5 business days. Simple restocking of Grade A items can happen within 24-48 hours of arrival. Refurbishment-required items take 3-7 business days, depending on complexity.
Returns exceeding 7 business days are a sign of understaffing, poor WMS integration, or unstructured receiving workflows.