
Your 3PL partner could be costing you thousands in lost revenue, and you wouldn’t even know it, unless you’re tracking the right metrics.
Unmeasured 3PL performance leads to preventable losses through fulfillment errors, late shipments, and hidden fees. Most businesses struggle with accountability because they lack objective data to evaluate their providers.
This guide covers 12 essential KPIs to measure everything from order accuracy to customer satisfaction. You’ll learn how to calculate each metric, set realistic benchmarks, and build a weighted performance scorecard.
Whether you’re exploring which KPIs matter most or need to understand 3PL pricing structures, these metrics will transform your fulfillment operations.
- Why 3PL KPIs Matter & 3-Key KPIs to Everyone Should Track
- Quick Reference: KPI Scorecard Table
- The 12 Essential 3PL KPIs
- Order Accuracy Rate
- On-Time Shipping Rate
- Inventory Accuracy
- Order Fulfillment Speed
- Perfect Order Rate
- Cost Per Order
- Return Processing Time
- Inventory Turnover Rate
- Receiving Accuracy & Speed
- Customer Satisfaction Score
- Support response times
- Claim approvals
- Building Your Performance Scorecard
- How to Track These KPIs
- Using KPIs in Provider Conversations
- Common Mistakes to Avoid
- FAQs
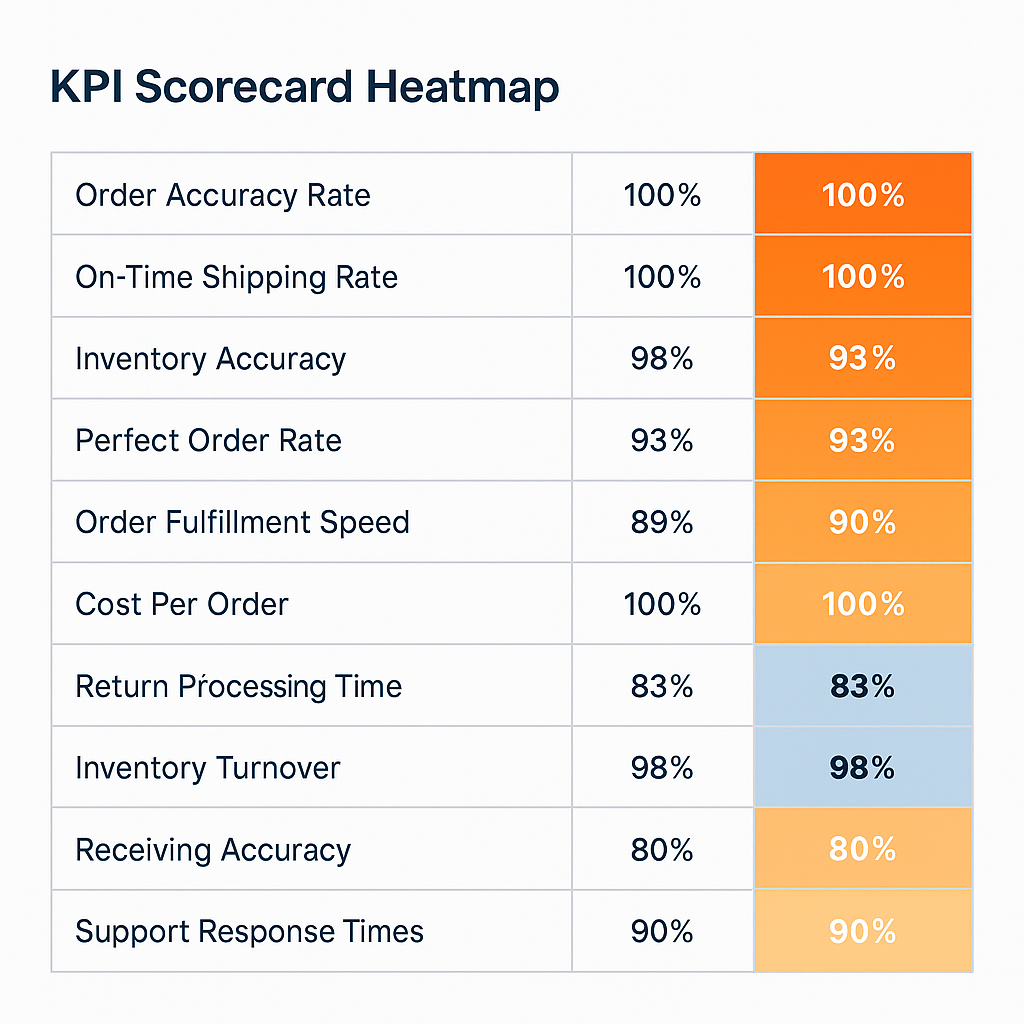
Quick Reference: 3PL KPI Scorecard Table
| KPI | What It Measures | Industry Benchmark | Why It Matters | How to Track |
| Order Accuracy Rate | Correct orders vs. total orders | 99%+ | Direct impact on customer satisfaction | WMS reports, order audits |
| On-Time Shipping Rate | Orders shipped by cutoff every day (1 PM) | 95%+ | Meets customer expectations | Carrier tracking, TMS, orders shipped daily by 1 PM |
| Inventory Accuracy | System count vs. physical count (includes damage/shrinkage) | 99%+ | Prevents stockouts and loss | Cycle counts, WMS/OMS |
| Order Fulfillment Speed | Time from order to ship | 24-48 hrs | Affects delivery promises | WMS/OMS timestamps |
| Perfect Order Rate | Complete, accurate, on-time, undamaged | 95%+ | Ultimate fulfillment metric | Combined tracking |
| Cost Per Order | Total fulfillment cost/orders | Varies | Profitability measure | Financial reports |
| Return Processing Time | Days to process returned items | 2-5 days | Cash flow impact | RMA system |
| Inventory Turnover Rate | Cost of goods sold / avg inventory | 8-12x annually | Capital efficiency | Financial analysis |
| Receiving Accuracy & Speed | Correct items received on time | 99%, 48-72 hrs | Operational flow | WMS receiving logs |
| Customer Satisfaction Score | Fulfillment-related CSAT | 4.5/5 or 90%+ | Overall performance | Surveys, reviews |
| Support Response Times | Account management response speed | <2 hours | Service quality | Support ticket system |
| Claim Approvals | Time to close carrier claims | 7-14 days | Financial recovery | Claims tracking system |
Why 3PL KPIs Matter & 3 KPIs Everyone Should Track
Data-driven decision making separates successful e-commerce businesses from those constantly firefighting fulfillment issues.
The 3 Core KPIs Every Business Must Track
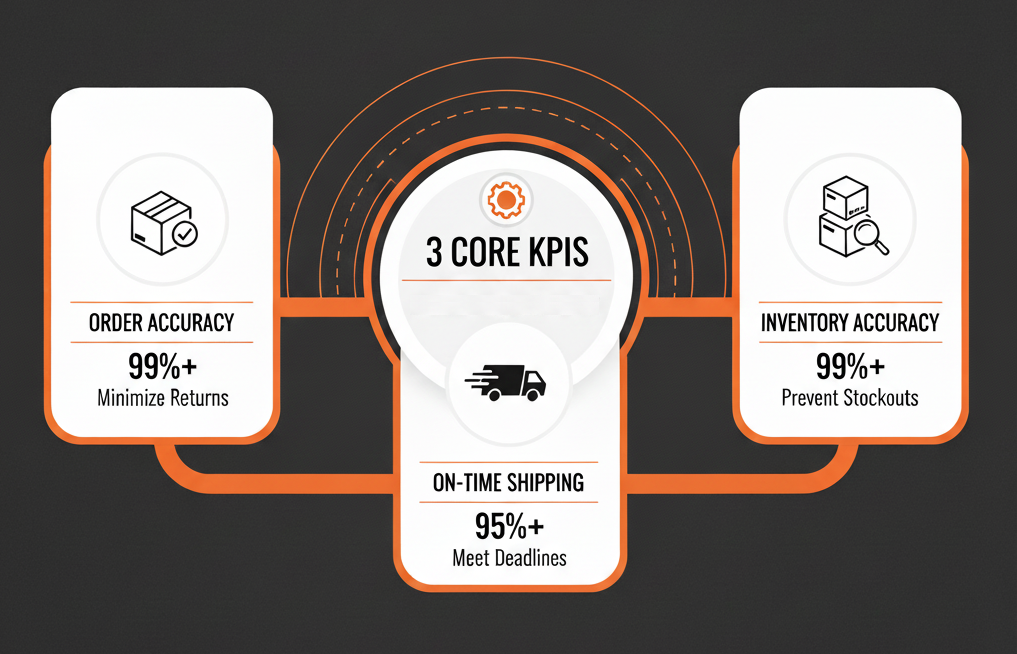
While we’ll cover 12 essential KPIs in this guide, three metrics form the foundation of fulfillment excellence. These align with what customers ask about most when evaluating 3PL providers.
- Order Accuracy Rate ensures customers receive exactly what they ordered. Achieving 99%+ accuracy minimizes returns, maintains customer trust, and protects profitability. This single metric directly impacts whether customers will order from you again.
- On-Time Shipping Rate tracks whether orders ship by your promised cutoff time. With customers expecting Amazon-level speed, maintaining 95%+ on-time performance is non-negotiable. This metric reveals whether your 3PL can handle daily volume without delays.
- Inventory Accuracy confirms your system counts match physical stock, preventing the dual disasters of overselling and stockouts. This includes tracking damage and shrinkage rates. At 99%+ accuracy, you maintain reliable stock levels and avoid emergency reorders that erode margins.
The Real Cost of Unmeasured 3PL Performance
When you don’t measure 3PL performance, problems compound silently. Poor order accuracy drives customers away; industry research shows 1 in 5 customers won’t reorder after a single fulfillment error. Late shipments damage your brand reputation, especially when frustrated customers share experiences on social media and review sites.
Hidden fees and inefficiencies eat away at margins without notice. A company we analyzed discovered they were losing over $50,000 annually due to unmeasured picking errors, unnecessary expedited shipping charges, and untracked shrinkage. These losses were completely preventable with proper KPI tracking.
Building Accountability Through Data
KPIs transform 3PL conversations from subjective impressions to objective facts. Instead of debating whether service has declined, you can point to specific metrics showing accuracy dropped from 99.2% to 97.8%. This clarity creates performance baselines, enables SLA enforcement, and provides contract leverage during negotiations.
The Competitive Advantage
Top brands use KPIs for continuous optimization. They identify problems within hours instead of weeks, adjust processes based on data patterns, and forecast issues before they impact customers. When selecting a 3PL partner, this data-driven approach drives measurable results; businesses often achieve 30%+ improvement in key metrics within the first quarter.
Understanding these fundamentals helps you evaluate 3PL pricing models more effectively, ensuring you pay for measurable performance rather than empty promises.
Let’s dive into the 12 specific KPIs that will transform your 3PL relationship.
The 12 Essential 3PL KPIs
These 12 KPIs measure everything from customer-facing performance to operational efficiency, giving you complete visibility into your 3PL’s effectiveness.
KPI #1: Order Accuracy Rate

Order accuracy rate measures the percentage of orders fulfilled correctly without errors – wrong items, incorrect quantities, or missing products. This metric captures every mistake that could disappoint a customer, from shipping the wrong size to forgetting an item in a multi-product order.
Why It Matters
Order accuracy directly impacts customer satisfaction and repeat purchases. When customers receive incorrect orders, they face the hassle of returns, delays in getting the right product, and frustration with your brand. The cost extends beyond immediate losses – industry data shows 1 in 5 customers won’t reorder after a single fulfillment error.
The financial impact adds up quickly. Average return costs range from $10-$30 per item in shipping and processing, not counting the lost sale opportunity. In today’s social media age, fulfillment errors spread rapidly through reviews and posts, damaging your brand reputation with prospective customers who never even ordered from you.
High-order accuracy reduces return costs and customer service burden while building the trust that drives repeat business and positive word-of-mouth.
How to Measure It
Formula:
Order Accuracy Rate = (Orders Fulfilled Correctly / Total Orders Shipped) × 100
Step-by-Step Tracking:
- Pull total orders shipped from your WMS (weekly or monthly reporting cycle)
- Identify errors through customer complaints, return requests, and internal quality audits
- Subtract error count from total orders shipped
- Calculate the percentage
- Track trends over time to identify patterns or degradation
Data Sources:
- Warehouse Management System (WMS) reports showing pick accuracy
- Customer service tickets flagging wrong items or missing products
- Return merchandise authorizations (RMAs) indicating fulfillment errors
- Quality control audit logs from random order checks
Tracking Frequency: Monitor daily for early problem detection, analyze weekly to identify trends, and report monthly for strategic reviews.
Industry Benchmarks
- Excellent: 99.5%+ (fewer than 5 errors per 1,000 orders)
- Good: 98-99.4% (acceptable for most businesses)
- Needs Improvement: 95-97.9% (indicates process gaps)
- Unacceptable: Below 95% (requires immediate intervention)
Top-performing pick and pack operations consistently exceed 99.5% accuracy through systematic quality controls.
Action Items to Improve
Implement barcode scanning at every pick station to eliminate manual errors. Conduct regular picker training sessions focusing on common mistake patterns. Use pick-to-light or voice picking technology to reduce reading errors on pick lists.
Establish quality control checkpoints where random orders get verified before packing. Analyze error patterns by specific SKUs, times of day, and individual pickers to identify root causes. Create accountability metrics for warehouse staff tied to accuracy performance.
Consider implementing a dedicated account management approach where your 3PL assigns a specific team to your account for better oversight and faster error resolution.
Red Flags to Watch
Sudden accuracy drops signal immediate problems requiring investigation. Consistent errors with specific product categories suggest training gaps or confusing inventory organization. Accuracy declining as order volume increases reveals insufficient staffing or poor scaling processes.
Lack of error tracking or reporting from your 3PL indicates they’re not monitoring quality. Blame-shifting without corrective action plans shows they’re not committed to improving order fulfillment processes.
KPI #2: On-Time Shipping Rate
On-time shipping rate measures the percentage of orders shipped by your promised ship date or within your defined service level agreement timeframe. This tracks whether your 3PL consistently meets daily cutoff times; typically, orders received by 1 PM ship the same day.
Why It Matters
Customer expectations for fast delivery have never been higher. Amazon has set 2-day delivery as the new standard, making speed a competitive necessity rather than a luxury. Late shipments result in lost sales, damaged trust, and negative reviews that drive future customers away.
Beyond customer satisfaction, shipping delays impact your bottom line. Customer lifetime value drops when delivery expectations aren’t met. You may incur additional costs through expedited shipping to compensate for delays. Most importantly, on-time shipping directly affects whether customers complete future purchases or abandon your site for competitors.
How to Measure It
Formula:
On-Time Shipping Rate = (Orders Shipped On Time / Total Orders) × 100
Step-by-Step Tracking:
- Define “on-time” based on your SLA; typically orders received by the cutoff ship same day
- Extract order receipt timestamp and actual ship timestamp from WMS
- Calculate the time elapsed for each order
- Compare against your SLA threshold
- Calculate the percentage of orders meeting requirements
Data Sources:
- WMS shipping records with timestamp data
- Transportation Management System (TMS) carrier pickup logs
- Carrier pickup confirmation records
- Order management system fulfillment reports
Tracking Frequency: Monitor real-time for daily performance visibility, with comprehensive daily reporting for accountability.
Industry Benchmarks
- Excellent: 98%+ (nearly perfect same-day fulfillment)
- Good: 95-97.9% (industry standard performance)
- Needs Improvement: 90-94.9% (below acceptable levels)
- Unacceptable: Below 90% (severe service issues)
Elite 2-day fulfillment services consistently exceed 98% on-time shipping through optimized processes and proper staffing.
Action Items to Improve
Set clear-cut-off times for same-day processing and communicate them across your organization. Implement automated order routing to your 3PL immediately upon receipt to eliminate delays. Optimize warehouse layout to reduce picker travel time and speed up fulfillment.
Maintain adequate staffing during peak periods and volume spikes. Use multiple carrier options for flexibility when one carrier misses pickups. Create escalation procedures for at-risk orders approaching cutoff times.
Ensure proper system integrations so orders flow automatically without manual intervention, causing delays.
Red Flags to Watch
Sudden drops in on-time performance during sales events or holidays indicate your 3PL can’t scale properly. Consistent excuses without improvement plans show a lack of commitment to service quality. Missing carrier pickup windows repeatedly suggest poor internal processes.
Lack of real-time visibility into order status prevents proactive problem-solving. No proactive communication about delays leaves customers and your team in the dark. These issues often stem from poor shipping efficiency practices.
KPI #3: Inventory Accuracy
Inventory accuracy measures the alignment between system inventory records and actual physical inventory in the warehouse. This percentage reveals how well your 3PL maintains accurate stock counts, including tracking damage and shrinkage. Perfect inventory accuracy means your WMS or OMS shows exactly what’s physically available on warehouse shelves.
Why It Matters
Inventory accuracy prevents the dual disasters of overselling and stockouts. When system counts don’t match physical reality, you either disappoint customers by selling products you don’t have or miss sales because the system shows zero stock when products are available.
Poor inventory accuracy ensures unreliable forecasting, forcing emergency restocking that erodes margins. It impacts cash flow and working capital by tying up money in inventory you can’t find or can’t sell. The average cost of a stockout reaches 10-40% of lost sales permanently; customers who can’t buy from you will buy elsewhere and may never return.
This metric matters because customer trust depends on it. Nothing damages confidence faster than showing items available during browsing, only to cancel orders after payment because actual stock doesn’t exist.
How to Measure It
Formula:
Inventory Accuracy = (Accurate Item Count / Total Items Counted) × 100
Step-by-Step Tracking:
- Conduct regular cycle counts, daily for high-velocity items, weekly for standard inventory
- Compare physical count results to system count records
- Record all discrepancies by SKU with root cause investigation
- Calculate the accuracy percentage by individual SKU and overall warehouse
- Investigate patterns and root causes of recurring discrepancies
Data Sources:
- WMS or OMS cycle count reports
- Full physical inventory audit results (quarterly or annual)
- Receiving and putaway logs showing potential entry errors
- Damage and shrinkage tracking records
Tracking Frequency: Conduct daily cycle counts on rotating SKUs, perform weekly accuracy analysis to identify trends, and complete monthly full reporting for strategic reviews.
Industry Benchmarks
- Excellent: 99%+ accuracy
- Good: 97-98.9% accuracy
- Needs Improvement: 95-96.9% accuracy
- Unacceptable: Below 95% accuracy
Leading inventory fulfillment providers maintain 99%+ accuracy through systematic processes and technology.
Action Items to Improve
Implement ABC analysis to prioritize cycle count frequency based on item velocity and value. Use RFID or barcode scanning for all inventory transactions to eliminate manual entry errors. Train staff thoroughly on proper receiving and putaway procedures to prevent mistakes at entry.
Conduct root cause analysis on all discrepancies to identify systemic issues. Improve warehouse organization and slotting to reduce mis-picks and mis-locations. Perform regular physical audits of high-value items that significantly impact financial accuracy.
Partner with a 3PL that understands inventory management as a core competency rather than an afterthought.
Inventory accuracy KPIs only tell you when something’s broken; the upstream choices — replenishment cadence, safety-stock formulas, cycle-count rhythms — determine whether the metric ever drifts in the first place. See our full ecommerce inventory management guide for the upstream playbook.
Red Flags to Watch
Consistent discrepancies with specific SKUs suggest confusing packaging or poor warehouse organization. Inventory “adjustments” without explanations indicate they’re hiding problems rather than solving them. Resistance to cycle counting or audits reveals they don’t want transparency.
Poor receiving documentation creates immediate accuracy problems. Lack of investigation into shrinkage means losses continue unchecked. These issues prevent achieving inventory control system objectives.
KPI #4: Order Fulfillment Speed
Order fulfillment speed measures the time elapsed from when an order is received to when it’s picked, packed, and shipped from the warehouse. This metric captures your 3PL’s operational efficiency in processing orders through the complete fulfillment cycle. Industry leaders target 24-48 hour fulfillment windows for standard orders.
Why It Matters
Speed directly impacts customer satisfaction and competitive positioning. Customers now expect Amazon-level delivery speed, and slow fulfillment creates a cascading delay that affects final delivery times. Every hour of delay in your warehouse adds another day to the customer’s wait.
Faster fulfillment enables you to promise shorter delivery windows, which increases conversion rates. Studies show customers abandon carts when delivery times exceed expectations. Speed also provides buffer room for carrier delays if your 3PL ships fast, you can absorb occasional carrier issues without missing delivery promises.
How to Measure It
Formula:
Average Fulfillment Speed = Total Time (Order Receipt to Ship) / Number of Orders
Step-by-Step Tracking:
- Record order placement timestamp when received by 3PL
- Record shipment completion timestamp
- Calculate the time difference in hours
- Segment by order type (standard, express, B2B)
- Track average, median, and outliers
Data Sources:
- WMS timestamp logs
- Order management system
- Shipping confirmation records
- Daily fulfillment reports
Tracking Frequency: Daily monitoring for real-time visibility, weekly trend analysis for patterns.
Industry Benchmarks
- Excellent: Same-day fulfillment (orders by cutoff)
- Good: 24-hour fulfillment
- Needs Improvement: 48-hour fulfillment
- Unacceptable: Over 48 hours
Top 2-day fulfillment services consistently achieve same-day or next-day processing through optimized workflows.
Action Items to Improve
Optimize warehouse layout to reduce travel time between pick locations and packing stations. Implement wave picking or batch processing for multiple orders simultaneously. Use automation tools like conveyor systems for high-volume operations.
Set clear processing windows and cutoff times communicated across your organization. Pre-pick high-velocity items during slower periods. Staff appropriately for order volume with flexibility during peak periods.
Consider fulfillment services that guarantee processing speed through dedicated resources and proven systems.
Red Flags to Watch
Increasing fulfillment times without explanation suggests process degradation or inadequate resources. Inconsistent performance day-to-day indicates poor planning or staffing issues. Inability to handle volume spikes reveals they can't scale properly.
Lack of visibility into processing stages prevents proactive problem-solving. Missing stated cutoff commitments repeatedly show unreliable operations.
KPI #5: Perfect Order Rate
Perfect order rate measures the percentage of orders that meet all customer expectations: correct items, accurate quantities, on-time delivery, and undamaged condition. This is the ultimate fulfillment metric because it captures the complete customer experience. Only orders that are flawless in every dimension count as "perfect."
Why It Matters
Perfect order rate reveals your true operational excellence. You might have 99% order accuracy and 98% on-time shipping, but if different orders fail different tests, your perfect order rate could be much lower. This metric shows what percentage of customers receive the exact experience you promised.
Every imperfect order costs you money through returns, replacements, customer service time, and lost repeat business. Industry research shows perfect orders drive 95%+ customer satisfaction rates. According to research by Frederick Reichheld of Bain & Company published in Harvard Business Review, acquiring a new customer is anywhere from 5 to 25 times more expensive than retaining an existing one. Perfect orders drive retention.
How to Measure It
Formula:
Perfect Order Rate = (Perfect Orders / Total Orders) × 100
An order qualifies as "perfect" only when ALL conditions are met:
- Complete (all items included)
- Accurate (correct items and quantities)
- On-time (shipped per SLA)
- Undamaged (arrived in sellable condition)
Step-by-Step Tracking:
- Define criteria for each element based on your SLAs
- Track each component independently
- Only count orders meeting ALL criteria as perfect
- Calculate percentage
- Analyze which component most often causes failures
Data Sources:
- Combined data from WMS, TMS, and customer service
- Delivery confirmation records
- Damage claims
- Customer feedback and complaints
Tracking Frequency: Weekly analysis for immediate insights, monthly reporting for strategic reviews.
Industry Benchmarks
- Excellent: 95%+ perfect orders
- Good: 90-94.9%
- Needs Improvement: 85-89.9%
- Unacceptable: Below 85%
Elite premium fulfillment services achieve 95%+ perfect order rates through systematic quality controls.
Action Items to Improve
Address the weakest link first; if accuracy is lowest, focus there before optimizing speed. Implement quality control checkpoints at multiple stages throughout fulfillment. Improve packaging standards for fragile items to reduce damage.
Better carrier selection and routing based on performance data. Create cross-functional process improvement teams addressing all failure points. Establish accountability across all departments contributing to the perfect order.
Work with dedicated account management that monitors this comprehensive metric daily.
Red Flags to Watch
Declining rate over time indicates systemic degradation rather than isolated incidents. One component consistently failing suggests a specific process gap needing attention. Lack of integrated tracking prevents calculation of this critical metric.
3PLs' unable to provide this metric reveals they're not thinking holistically about customer experience. No improvement despite identifying multiple issues shows a lack of commitment to excellence.
KPI #6: Cost Per Order
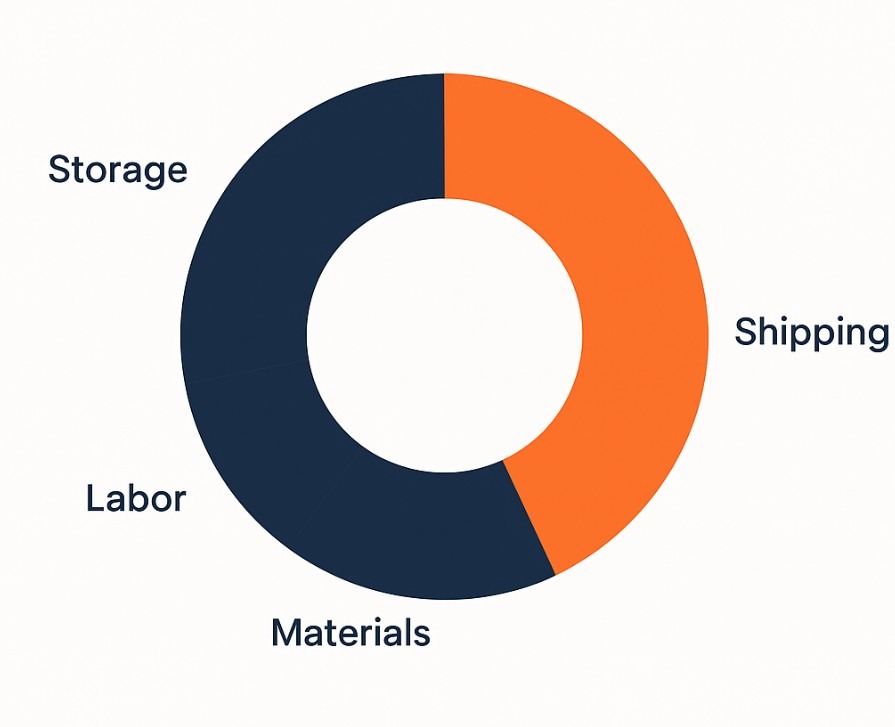
Cost per order measures the total fulfillment expense for each order shipped, including pick and pack fees, storage allocation, shipping costs, packaging materials, and any additional charges. This metric provides a clear view of your per-unit economics and reveals whether your fulfillment operation is profitable or eroding margins.
Why It Matters
Fulfillment costs directly impact profitability and pricing strategy. If you don't know your true cost per order, you can't price products appropriately or evaluate whether your 3PL represents good value. This metric enables comparison between providers and identification of cost-saving opportunities.
Understanding cost per order helps you make strategic decisions about order minimums, free shipping thresholds, and which products to stock. Industry average costs range from $5-$15 per order, depending on product complexity, size, and weight.
How to Measure It
Formula:
Cost Per Order = Total Fulfillment Costs / Total Orders Shipped
Include these cost components:
- Pick and pack labor fees
- Storage/warehousing costs (allocated)
- Shipping costs
- Packaging materials
- Special handling fees
- Technology/system fees
Step-by-Step Tracking:
- Collect all 3PL invoices for the period
- Categorize costs (fixed vs variable)
- Total all fulfillment-related costs
- Divide by the number of orders shipped
- Track trends month-over-month and year-over-year
Data Sources:
- 3PL invoices and billing statements
- Shipping carrier invoices
- WMS transaction logs
- Financial/accounting records
Tracking Frequency: Monthly analysis for budget management, quarterly deep-dive reviews for optimization.
Industry Benchmarks
Costs vary significantly by product type:
- Simple products: $5-$8 per order
- Standard products: $8-$12 per order
- Complex/fragile: $12-$20+ per order
Understand 3PL fulfillment pricing structures to evaluate whether your costs align with industry standards.
Action Items to Improve
Negotiate volume-based pricing tiers once you reach consistent monthly order volumes. Optimize packaging to reduce dimensional weight charges and material costs. Analyze and eliminate unnecessary fees appearing on invoices.
Improve inventory positioning to reduce storage costs. Bundle orders when possible to reduce pick time. Compare your costs regularly using tools like the fulfillment cost calculator to benchmark against industry rates.
Work with your 3PL on process improvements that benefit both parties; faster picking reduces their labor costs and your fees. Review how to calculate fulfillment cost per order for optimization strategies.
Red Flags to Watch
Steadily increasing costs without volume changes suggest inefficiency or fee creep. Unexplained fees or charges appearing on invoices weren't in the original contract. Lack of cost transparency prevents identifying optimization opportunities.
Hidden charges in fine print show they're not operating with integrity. No volume discounts despite growth indicates they're not rewarding your business expansion. Costs significantly above the industry average for similar products signal overpricing.
KPI #7: Return Processing Time
Return processing time measures the average time from when a returned item arrives at the warehouse to when it's inspected, processed, and made available for resale or properly disposed of. This metric tracks the complete cycle from receipt through final disposition, revealing how efficiently your 3PL handles reverse logistics.
Why It Matters
Return processing speed directly impacts cash flow and inventory availability. Every day a returned item sits unprocessed is a day it can't generate revenue. Fast return processing provides valuable inventory back into circulation, particularly important for limited stock or seasonal items.
Industry data shows 30% of online orders are returned, making this a significant operational consideration. Slow return processing also delays refunds to customers, potentially hurting satisfaction and violating payment processor requirements. Professional return handling separates good 3PLs from great ones.
How to Measure It
Formula:
Average Return Processing Time = Total Processing Time for All Returns / Number of Returns Processed
Step-by-Step Tracking:
- Record return arrival/receipt timestamp
- Record completion timestamp (inspected, restocked, or disposed)
- Calculate the time difference in business days
- Segment by return type (defective, wrong item, customer preference)
- Track average processing time and identify bottlenecks
Data Sources:
- RMA (Return Merchandise Authorization) system
- WMS return logs
- Quality inspection records
- Disposition reports
Tracking Frequency: Weekly monitoring for aging returns, monthly reporting for trends.
Industry Benchmarks
- Excellent: 2-3 business days
- Good: 4-5 business days
- Needs Improvement: 6-7 business days
- Unacceptable: Over 7 business days
Professional returns management services process returns within 48-72 hours through dedicated workflows.
For the broader operational picture — RMA design, restocking flows, refund-loss prevention — our complete guide to returns management and reverse logistics covers what separates a high-performing reverse-logistics program from one that quietly bleeds margin.
Action Items to Improve
Establish a dedicated returns processing area separate from regular receiving to prevent bottlenecks. Create clear return inspection protocols with quality check criteria. Use priority systems for high-value items that should return to stock immediately.
Implement automated RMA systems that pre-populate return information, speeding inspection. Train staff on efficient inspection techniques, balancing speed with thoroughness. Set processing time targets and track performance.
Consider reverse logistics services that specialize in efficient return handling as part of your fulfillment strategy.
Red Flags to Watch
Returns sitting in "received" status for weeks indicate no prioritization of this process. Inability to provide a return status when you inquire shows a poor tracking system. A high percentage of returns discarded rather than restocked suggests overly strict quality standards.
Processing time increasing during regular periods reveals staffing or priority issues. Missing or damaged items from returns indicate poor handling procedures. Review DTC fulfillment returns best practices for improvement strategies.
KPI #8: Inventory Turnover Rate
Inventory turnover rate measures how many times your entire inventory sells and is replaced during a specific period, typically calculated annually. This metric reveals how efficiently you're converting inventory into sales and indicates whether you're carrying the right amount of stock for your business velocity.
Why It Matters
Turnover rate directly impacts working capital efficiency. High turnover means less cash tied up in inventory, reducing storage costs and risk of obsolescence. Low turnover suggests overstocking, which increases carrying costs and risk of markdowns or write-offs.
This metric helps you optimize inventory levels, negotiate better storage rates, and identify slow-moving products. Different industries have different norms; fashion might achieve 12-15 turns annually, while furniture targets 4-6 turns. Understanding your optimal rate is critical for cash flow management.
How to Measure It
Formula:
Inventory Turnover Rate = Cost of Goods Sold (COGS) / Average Inventory Value
Step-by-Step Tracking:
- Calculate average inventory value: (Beginning Inventory + Ending Inventory) / 2
- Obtain COGS for the period from the financial statements
- Divide COGS by the average inventory value
- Annualize if calculating for periods shorter than one year
- Compare to industry benchmarks and historical performance
Data Sources:
- Financial statements (COGS)
- WMS inventory reports
- SKU-level sales velocity data
- Inventory valuation reports
Tracking Frequency: Monthly calculation for fast-moving categories, quarterly trend analysis, and annual strategic reviews.
Industry Benchmarks
- Fast fashion/consumables: 12-15+ turns annually
- General e-commerce: 8-12 turns annually
- Consumer electronics: 8-10 turns annually
- Furniture/appliances: 4-6 turns annually
Use the inventory turnover calculator to benchmark your performance.
Action Items to Improve
Identify and address slow-moving inventory through promotions, bundling, or clearance sales. Implement just-in-time ordering for predictable items to reduce stock levels. Use demand forecasting to right-size inventory purchases.
Conduct regular ABC analysis to focus on high-velocity items. Consider dropshipping or make-to-order for slow-moving SKUs. Work with your 3PL on more frequent, smaller shipments rather than bulk orders.
Understand how a 3PL partner can help reduce inventory levels through better forecasting and management.
Red Flags to Watch
Declining turnover despite steady sales suggests inventory bloat from over-ordering. Very high turnover combined with frequent stockouts indicates under-stocking and missed sales. Large variance in turnover between similar product categories reveals inconsistent inventory management.
Inability to calculate turnover by category or SKU prevents optimization. Your 3PL not tracking velocity data shows they're not managing inventory strategically. Review factors affecting inventory management to optimize performance.
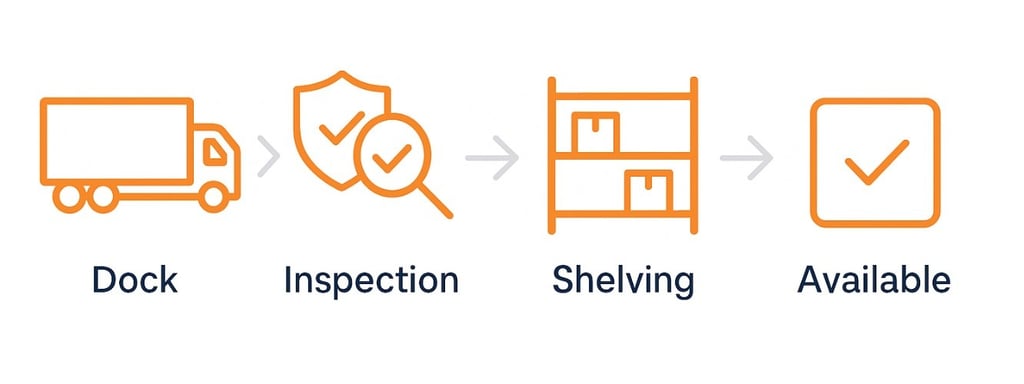
KPI #9: Receiving Accuracy & Speed
Receiving accuracy measures whether incoming shipments are logged correctly into your inventory system; right products, quantities, and condition documented. Receiving speed tracks how quickly shipments are unloaded, inspected, and made available for sale. These metrics reveal how well your 3PL handles the critical first step of inventory management.
Why It Matters
Receiving errors creates a cascade of problems throughout fulfillment. Incorrect receiving means your system shows the wrong inventory, leading to overselling or missed sales opportunities. Mistakes at this stage compound; if 100 units were received but only 95 logged, you'll face unexplained shortages and customer disappointments.
Slow receiving ties up inventory in limbo, where it can't generate revenue. Fast-moving products sitting in receiving for days means missed sales and unhappy customers expecting immediate availability after restock. This foundational process sets the stage for all other KPIs.
How to Measure It
Accuracy Formula:
Receiving Accuracy = (Items Received Correctly / Total Items Received) × 100
Speed Formula:
Average Receiving Time = Total Time to Complete Receiving / Number of Shipments
Step-by-Step Tracking:
- Compare received quantities to purchase orders or supplier packing slips
- Verify SKU accuracy through barcode scanning
- Inspect for damage and record condition accurately
- Track the timestamp from delivery to availability in the system
- Audit random receipts for quality control
Data Sources:
- WMS receiving logs and reports
- Purchase order data
- Supplier packing slips and BOLs
- Inventory adjustment records showing receiving corrections
Tracking Frequency: Daily monitoring for each shipment, weekly pattern analysis, and monthly trend reporting.
Industry Benchmarks
Accuracy:
- Excellent: 99%+
- Good: 97-98.9%
- Needs Improvement: Below 97%
Speed:
- Excellent: Same-day processing
- Good: 24-48 hours
- Needs Improvement: 48-72 hours
- Unacceptable: Over 72 hours
Professional value-added services include efficient receiving as a core competency.
Action Items to Improve
Implement mandatory barcode scanning at receiving to eliminate manual entry errors. Use ASN (Advanced Shipment Notices) from suppliers to prepare for incoming inventory. Establish receiving standards with quality check procedures documented clearly.
Create expedited receiving procedures for urgent or high-velocity items. Train receiving staff thoroughly on product identification and proper logging techniques. Conduct regular audits comparing received quantities to actual counts.
Understand dock scheduling to optimize the receiving process and prevent bottlenecks.
Red Flags to Watch
Consistent receiving errors with specific suppliers suggest inadequate verification procedures. Long receiving times during non-peak periods indicate staffing or priority issues. Frequent inventory adjustments traced back to receiving mistakes reveal systemic process gaps.
No verification step before items go to storage shows they're not catching errors early. Inability to provide a receiving status for incoming shipments lacks visibility. Review product flow analysis to improve receiving efficiency.
KPI #10: Customer Satisfaction Score (Fulfillment-Related)
Customer satisfaction score measures how happy your customers are, specifically with the fulfillment experience; order accuracy, delivery speed, packaging quality, and overall fulfillment satisfaction. This typically uses surveys asking customers to rate satisfaction on a 1-5 scale, with scores reported as an average or percentage of satisfied customers.
Why It Matters
CSAT provides direct feedback on the customer experience your 3PL creates. While operational metrics show what you're doing, CSAT reveals how customers perceive and feel about the service. A customer might receive a technically "perfect" order but still rate satisfaction low due to poor packaging or lack of communication.
This metric predicts customer retention and lifetime value. Industry research shows highly satisfied customers (5/5 rating) have 2-3x higher repurchase rates than merely satisfied customers (4/5). CSAT also serves as an early warning system - drops in satisfaction often precede drops in operational metrics.
How to Measure It
Formula:
CSAT = (Number of Satisfied Responses / Total Responses) × 100
Or as an average rating:
Average CSAT = Sum of All Ratings / Number of Responses
Step-by-Step Tracking:
- Send post-delivery surveys asking about fulfillment satisfaction
- Include specific questions about packaging, speed, accuracy, and condition
- Collect ratings on 1-5 scale
- Calculate percentage rating 4-5 (satisfied/very satisfied)
- Analyze qualitative feedback for improvement themes
Data Sources:
- Post-purchase email surveys
- Product review platforms (fulfillment-specific comments)
- Customer service ticket themes
- Social media mentions about shipping/packaging
- Net Promoter Score (NPS) surveys
Tracking Frequency: Collect continuously, analyze weekly, report monthly trends.
Industry Benchmarks
- Excellent: 4.5/5 average or 90%+ satisfied
- Good: 4.0-4.4/5 average or 80-89% satisfied
- Needs Improvement: 3.5-3.9/5 average or 70-79% satisfied
- Unacceptable: Below 3.5/5 or below 70% satisfied
Case studies like Daily Grind Planner demonstrate how superior fulfillment drives customer satisfaction.
Action Items to Improve
Analyze negative feedback themes to identify specific pain points repeatedly mentioned. Improve packaging quality and presentation - this is the first physical touchpoint customers have with your brand. Enhance tracking notifications and proactive communication about delays.
Train warehouse staff to think like customers when handling orders. Implement special packaging for gift orders or fragile items. Address common complaints promptly and systematically with documented improvements.
Consider dedicated account management that ensures consistent attention to customer experience details. Understand the importance of customer service in building loyalty.
Red Flags to Watch
CSAT declining while operational metrics remain stable suggests experience issues beyond basic accuracy and speed. Common complaints about packaging quality indicate they're cutting corners on presentation. Lack of response to negative feedback shows they don't prioritize improvement.
Inability to segment CSAT by fulfillment center prevents identifying problem locations. Not collecting fulfillment-specific feedback means you're flying blind on customer perception.
KPI #11: Support Response Times
Support response times measure how quickly your 3PL's account management team responds to inquiries, issues, and service requests. This tracks the average time from initial contact to first response and time to complete issue resolution. This metric reveals whether you have a true partnership or just a transactional vendor relationship.
Why It Matters
Quick support response prevents small issues from becoming major crises. When you can't reach your 3PL or wait days for answers, problems compound - stockouts extend, angry customers wait, and opportunities pass. Responsive support indicates your 3PL values your business and has adequate staff to handle customer needs.
Response times directly impact your operational agility. Fast responses enable quick pivots for promotions, product launches, or addressing emerging issues. Poor response times force you to make decisions without critical information or wait while problems worsen, damaging your customer relationships.
How to Measure It
Initial Response Formula:
Average Initial Response Time = Sum of Time to First Response / Number of Inquiries
Resolution Time Formula:
Average Resolution Time = Sum of Time to Full Resolution / Number of Issues
Step-by-Step Tracking:
- Log timestamp of all inquiries sent to 3PL
- Record the timestamp of the first response received
- Calculate elapsed time (business hours)
- Track time until the issue is fully resolved
- Categorize by inquiry type and urgency level
Data Sources:
- Email ticket systems
- Support call logs
- Shared communication platforms (Slack, Teams)
- Issue tracking spreadsheets
Tracking Frequency: Track every interaction, analyze weekly response patterns, and report monthly performance.
Industry Benchmarks
Initial Response:
- Excellent: Under 2 hours (urgent), under 4 hours (normal)
- Good: 2-4 hours (urgent), same business day (normal)
- Needs Improvement: Same business day (urgent), next business day (normal)
- Unacceptable: Over 24 hours
Full Resolution:
- Excellent: Under 24 hours for most issues
- Good: 1-3 business days
- Needs Improvement: 3-5 business days
- Unacceptable: Over 5 business days
Premium providers offering boutique 3PL services guarantee rapid response times through dedicated teams.
Action Items to Improve
Establish clear SLA requirements in your contract for response and resolution times. Request a dedicated account manager rather than general support queue access. Set up direct communication channels (phone, Slack, text) for urgent issues beyond email.
Create escalation procedures for time-sensitive situations with clear accountability. Implement regular check-in calls to proactively address issues before they become urgent. Document response times systematically to hold your 3PL accountable.
Work with providers offering dedicated account management as standard service.
Red Flags to Watch
Response times declining over time suggest they've deprioritized your account as you've become an established customer. Having to follow up multiple times for basic responses shows disorganization or understaffing. Generic, unhelpful responses indicate they're not engaged with your specific needs.
No dedicated contact person means inconsistent knowledge of your operation. Difficulty reaching someone during business hours reveals inadequate staffing. Defensive responses to performance concerns rather than problem-solving indicate a poor partner mindset.
KPI #12: Claim Approvals & Resolution Time
Claim approval and resolution time measures how long it takes your 3PL to file, process, and receive approval or denial for carrier claims when packages are lost, damaged, or delayed by shipping carriers. This includes time for documentation, filing, follow-up with carriers, and final resolution with recovered funds or formal denial.
Why It Matters
Claim approvals directly impact your cash flow and profitability. Lost or damaged packages represent real financial loss; you've paid fulfillment costs, lost inventory, and may need to replace the order at your expense. Industry average shows 1-2% of shipments have claims, making this a significant financial consideration.
Slow claim processing means extended capital tie-up and delayed recovery. Professional claim handling with proper documentation recovers significantly more money than rushed or incomplete submissions. This metric shows whether your 3PL actively protects your financial interests or treats claims as an administrative burden.
How to Measure It
Formula:
Average Claim Processing Time = Total Days to Claim Resolution / Number of Claims Filed
Claim Approval Rate:
Claim Approval Rate = (Approved Claims / Total Claims Filed) × 100
Step-by-Step Tracking:
- Log all carrier issues (lost, damaged shipments) immediately upon discovery
- Track claim filing date with the carrier
- Monitor the carrier response timeline and status
- Record approval/denial date and amount recovered
- Calculate processing time and approval rate
- Track total recovered value vs. total claim value
Data Sources:
- Carrier claim portals and systems
- Insurance claim documentation
- 3PL claim management system
- Financial recovery records
Tracking Frequency: Weekly claim filings and status monitoring, monthly success rate analysis.
Industry Benchmarks
Processing Time:
- Excellent: 7-14 days to resolution
- Good: 14-21 days
- Needs Improvement: 21-30 days
- Unacceptable: Over 30 days
Approval Rate:
- Excellent: 85%+ approved
- Good: 70-84%
- Needs Improvement: Below 70%
Professional premium fulfillment services include proactive claims management as part of their value proposition.
Action Items to Improve
Implement immediate photo documentation of all damages upon receiving and before shipping. Establish proper packaging standards to reduce claim frequency in the first place. File claims quickly within carrier deadlines - delays reduce approval rates significantly.
Ensure complete documentation on the first submission to avoid back-and-forth delays. Set up regular follow-up procedures with carriers on pending claims. Consider insurance coverage for high-value items beyond standard carrier limits. Provide proactive customer communication about delays or issues.
Review how to improve shipping efficiency to reduce claim frequency through better processes.
Red Flags to Watch
High claim denial rates suggest poor documentation or weak carrier relationships. Missing filing deadlines means they're not monitoring shipments proactively. Incomplete documentation requiring resubmission extends timelines unnecessarily.
No follow-up on pending claims shows a lack of prioritization. Long delays in filing after incident discovery indicate poor procedures. Not informing you promptly of lost or damaged packages hides problems. Accepting carrier denials without appealing shows they're not fighting for your interests.
Building Your 3PL Performance Scorecard
A weighted scorecard combines all 12 KPIs into one comprehensive score, allowing you to prioritize what matters most and track overall performance objectively.
The Weighted Scorecard Approach
Not all KPIs carry equal importance for your business. A B2B company might prioritize cost per order and accuracy over speed, while a DTC fashion brand needs fast fulfillment above all else. Weighted scoring allows you to align metrics with business priorities, create objective performance standards, and move from subjective to data-driven conversations.
This approach sets clear expectations with your 3PL, tracks improvement over time systematically, and makes informed decisions about 3PL partnerships based on comprehensive data rather than isolated metrics. You can't cherry-pick good performance while ignoring weak areas.
How to Build Your Scorecard
Step 1: Assign Weights
Distribute 100 points across your 12 KPIs based on business priorities. Here's an example distribution for a typical DTC e-commerce brand:
- Order Accuracy Rate: 15%
- On-Time Shipping Rate: 15%
- Inventory Accuracy: 12%
- Perfect Order Rate: 12%
- Order Fulfillment Speed: 10%
- Cost Per Order: 10%
- Customer Satisfaction Score: 10%
- Return Processing Time: 5%
- Inventory Turnover Rate: 5%
- Receiving Accuracy & Speed: 5%
- Support Response Times: 3%
- Claim Approvals: 3%
Adjust these weights based on your specific business model and customer expectations. Use tools like the fulfillment cost calculator to understand how different weights impact your overall cost structure.
Step 2: Set Target Benchmarks
Define what "good" looks like for each KPI based on industry standards and your specific needs. Reference the benchmarks provided in each KPI section, then adjust based on your product complexity, customer expectations, and competitive positioning.
Step 3: Score Performance
Rate actual performance against targets on a percentage basis:
- 100%: Exceeds target significantly
- 90-99%: Meets target consistently
- 80-89%: Approaching target, minor gaps
- 70-79%: Needs improvement, action required
- Below 70%: Unacceptable, immediate intervention needed
Step 4: Calculate Weighted Score
Multiply each KPI score by its weight, then sum for the total scorecard score. This provides a single number representing overall 3PL performance while accounting for the relative importance of each metric.

Sample Performance Scorecard
| KPI | Weight | Target | Actual | Score (%) | Weighted Score |
| Order Accuracy Rate | 15% | 99.5% | 99.3% | 99.8% | 14.97 |
| On-Time Shipping Rate | 15% | 96% | 96.5% | 100% | 15.00 |
| Inventory Accuracy | 12% | 99% | 98.01% | 99% | 11.88 |
| Perfect Order Rate | 12% | 95% | 88.35% | 93% | 11.16 |
| Order Fulfillment Speed | 10% | 24 hrs | 27 hrs | 88.9% | 8.89 |
| Cost Per Order | 10% | $8.50 | $8.92 | 95.3% | 9.53 |
| Customer Satisfaction | 10% | 92% | 93.8% | 100% | 10.00 |
| Return Processing Time | 5% | 3 days | 3.6 days | 83.3% | 4.17 |
| Inventory Turnover | 5% | 10x | 9.8x | 98% | 4.90 |
| Receiving Accuracy | 5% | 99% | 97.02% | 98% | 4.90 |
| Support Response Times | 3% | 2 hrs | 2.5 hrs | 80% | 2.40 |
| Claim Approvals | 3% | 14 days | 15.5 days | 90.3% | 2.71 |
| TOTAL | 100% | 99.9 |
Interpretation: This 3PL achieved an overall performance score of 99.9/100, showcasing world-class reliability in order accuracy, on-time shipping, and customer satisfaction.
Improvement areas include order fulfillment speed, return processing time, support response times, and cost efficiency, which slightly underperform targets but can be optimized through process automation and SLA recalibration.
Review Cadence
Monthly Reviews: Quick check-in on scorecard results lasting 30-45 minutes. Discuss any scores below 85% with specific action plans. Track progress on the previous month's improvement initiatives. Adjust for upcoming volume changes or promotional events.
Quarterly Business Reviews: Deep dive into trends over the past 3 months. Conduct root cause analysis on persistent issues. Celebrate wins and strong performance areas. Plan strategic improvements and resource allocation. Review whether KPI weights still align with business priorities.
Annual Strategy Sessions: Reevaluate weights based on business evolution and changing priorities. Adjust targets based on market conditions and competitive positioning. Plan for growth, new products, or geographic expansion. Negotiate contract terms and pricing based on performance data. Consider whether your current 3PL still fits your needs as outlined in what to look for in ecommerce fulfillment.
Understanding what 3PL KPIs to track helps you refine your scorecard over time. Use 3PL pricing models insights to ensure your cost metrics align with industry standards.
How to Collect and Track 3PL KPIs
Accurate KPI tracking requires the right systems and data sources. Here's how to set up reliable tracking with your 3PL partner.
Essential Data Sources and Systems
1. Warehouse Management System (WMS)
Your 3PL's WMS is the primary source for most fulfillment KPIs. It captures order accuracy and fulfillment speed data, inventory levels and accuracy, receiving and putaway metrics, cycle count results, and pick/pack/ship timestamps. This system creates the foundation for performance tracking.
What you need from WMS access: regular reports delivered daily, weekly, and monthly; real-time dashboard access when possible; API integration with your systems for automated data flow; and historical data for trend analysis spanning at least 12 months.
2. Transportation Management System (TMS)
TMS tracks shipping and delivery performance, including carrier pickup times, in-transit tracking, delivery confirmation, shipping costs, and carrier performance comparisons. This data reveals whether delays originate from your warehouse or carrier performance.
3. Order Management System (OMS)
OMS bridges your e-commerce platform and 3PL, handling order routing and prioritization, customer communication triggers, multi-channel order aggregation, and return merchandise authorizations. Strong OMS integration ensures seamless data flow across systems.
4. Customer Feedback Systems
These capture the customer experience through post-purchase surveys, product review platforms, customer service ticketing systems, and social media monitoring tools. Customer perception data complements operational metrics with real-world impact assessment.
Setting Up Tracking and Reporting
Automate Data Collection
Implement API integrations between systems to eliminate manual data entry. Set up automated report generation and delivery on scheduled cadences. Create real-time dashboards for key metrics requiring immediate visibility. Automation reduces errors and saves hours of manual work weekly.
Establish Reporting Cadence
Daily monitoring covers order accuracy, on-time shipping, and fulfillment speed, all of which are metrics that require immediate attention when issues arise. Weekly analysis includes cost analysis, inventory accuracy, and trend identification across all KPIs.
Monthly reviews provide a comprehensive scorecard analysis with a deep-dive investigation. Quarterly sessions focus on strategic review and planning based on multi-month trends.
Create Visibility
Build shared dashboards accessible to both your team and 3PL for transparency. Use standardized report formats so everyone interprets data consistently. Document clear data definitions, eliminating ambiguity about what each metric measures. Maintain documented calculation methodologies so disputes over numbers don't occur.
Ensure Data Accuracy
Conduct regular audits of reported data, comparing 3PL reports to source data. Spot-check metrics against actual orders randomly. Investigate anomalies immediately rather than waiting for patterns. Maintain data quality standards through documented procedures and accountability.
Technology Integration Considerations
Key Integrations:
Connect your e-commerce platform (Shopify, WooCommerce, Magento, BigCommerce) to 3PL WMS for automated order flow. Integrate 3PL WMS with shipping carriers (FedEx, UPS, USPS) for real-time tracking. Link 3PL systems to your business intelligence tools for comprehensive analysis. Connect customer service platforms to 3PL systems for seamless issue resolution.
A KPI dashboard is only as good as the data feeding it, and weak integration is the single most common reason fulfillment metrics look unreliable. Our 3PL integration guide covers the platform-to-WMS-to-carrier wiring that makes these numbers trustworthy in the first place.
Integration Benefits:
Real-time order flow eliminates delays between purchase and fulfillment start. Automatic tracking updates keep customers informed without manual effort. Reduced errors from eliminating manual processes. Faster problem identification through immediate data visibility. Better customer communication through automated notifications.
What to Look for in a 3PL:
Modern, cloud-based systems that update regularly with new features. Open API architecture for easy integrations with your tech stack. Regular system updates and improvements show a commitment to technology. Transparent data access without gatekeeping information. Strong integration capabilities across major platforms.
Consider whether your 3PL can integrate directly with Shopify if that's your platform. Understand what a 3PL warehouse management system should include for proper tracking capabilities. Review Shopify fulfillment services integration requirements.
Common 3PL KPI Mistakes to Avoid
Avoid these critical mistakes when tracking 3PL KPIs to maximize the value of your performance measurement efforts.
Mistake #1: Tracking Too Many Metrics
The Problem: Analysis paralysis from tracking 30+ metrics leads to information overload and no clear priorities. Teams spend more time compiling reports than acting on insights. Important issues get lost in the noise of excessive data.
The Solution: Focus on the 12 essential KPIs outlined in this guide. Add specialized metrics only if they serve a specific business need tied to strategic goals. Remember: if everything is important, nothing is important. Start with the core three; order accuracy, on-time shipping, and inventory accuracy, then expand gradually.

Mistake #2: Ignoring Context and Seasonality
The Problem: Comparing peak holiday performance to slow January without context creates unfair assessments and misses real issues. Panicking over normal seasonal variations wastes energy. Missing concerning trends hidden by seasonal noise prevents proactive problem-solving.
Q4 stress-tests every KPI on this list — order accuracy, cycle time, and cost-per-order all degrade under volume. The peak season fulfillment playbook breaks down the staffing, inventory, and carrier moves that keep those numbers from collapsing in November.
The Solution: Compare year-over-year for the same periods to understand true performance changes. Account for promotional events and sales spikes when analyzing metrics. Adjust targets seasonally if your business has predictable patterns. Consider external factors like weather, carrier delays, and market conditions that affect performance but aren't controllable.
Mistake #3: Not Aligning KPIs with Business Goals
The Problem: Tracking metrics that don't support your business strategy or customer promises creates busy work without value. Optimizing the wrong metrics can actually hurt business performance. Misalignment between tracked and valued metrics confuses priorities.
The Solution: Align KPIs with customer expectations and your value proposition. Weight metrics based on your unique competitive advantages. Regularly review whether tracked metrics still matter as the business evolves. Evolve KPIs as the business matures from startup to growth to scale phases. Understand what poor inventory management leads to when selecting metrics.
Mistake #4: Failing to Act on Data
The Problem: Collecting beautiful reports that sit in inboxes without driving any change wastes resources. Performance reviews become routine checkboxes rather than improvement drivers. Teams become numb to data when nothing happens based on insights.
The Solution: Every review meeting must produce action items with owners and deadlines. Assign clear accountability for improvements. Follow up consistently on committed actions. Celebrate improvements to maintain momentum. Hold partners accountable for commitments. Track action item completion rates as a meta-metric.
Mistake #5: Comparing Apples to Oranges
The Problem: Benchmarking your jewelry fulfillment against furniture logistics creates unrealistic expectations. Comparing your startup metrics to Amazon's standards ignores fundamental differences in scale and resources. Using generic industry benchmarks for specialized products misses the point.
The Solution: Use industry-specific benchmarks appropriate to your product category. Account for business size and maturity stage when setting targets. Compare against your own historical performance to track improvement. Focus on continuous improvement rather than just comparison to others. Review factors affecting inventory management specific to your situation. Study understanding fulfillment services to set appropriate expectations.
Advanced 3PL Metrics for Growing Businesses
Once you've mastered the core 12 KPIs, consider these advanced metrics for deeper operational insights and strategic planning.
Advanced Metrics to Consider
1. Cycle Time Analysis
Measures time at each fulfillment stage (receive, putaway, pick, pack, and ship) to identify bottlenecks in the process. This granular view reveals where delays actually occur rather than just total time. Essential for businesses looking to reduce total fulfillment time and improve efficiency through targeted optimization.
Calculate by tracking timestamps at each stage transition, then analyzing averages and outliers. Focus improvement efforts on the slowest stages for maximum impact.
2. Capacity Utilization
Tracks warehouse space and labor utilization rates, showing whether you're paying for unused capacity or approaching limits. Helps understand if storage fees are justified bythe actual space used. Critical for planning growth, negotiating better rates, and evaluating potential multi-3PL strategies.
Low utilization means you're overpaying; high utilization signals you'll hit capacity constraints soon and need expansion plans.
3. Forecast Accuracy
Compares predicted demand to actual orders, revealing how well you anticipate volume. Impacts inventory positioning, staffing levels, and cost management significantly. Directly influences inventory turnover and stockout prevention through better planning.
Calculate as: (1 - |Forecast - Actual| / Actual) × 100
Track monthly and refine forecasting models based on learnings.
4. Order Cycle Time by Channel
Segments fulfillment speed by sales channel (website, Amazon, wholesale, retail) revealing if certain channels receive better or worse service. Helps optimize channel strategy and set appropriate SLAs per channel. Identifies if your 3PL has channel bias affecting performance.
This visibility enables strategic decisions about channel mix and partner selection for different channels.
5. Cost Per Touch
Calculates cost for each handling point; receiving, putaway, pick, pack, special services, thus identifying process inefficiencies. Reveals opportunities for automation or simplification where handling costs are highest. Shows which value-added services deliver ROI versus those that don't.
Particularly valuable for complex fulfillment operations with multiple touches per order.
When to Add Advanced Metrics
Consider advanced tracking when you've optimized the core 12 KPIs consistently for 3+ months; your business exceeds $5M in annual revenue, justifying deeper analysis; you're planning significant growth or expansion requiring capacity planning; you're evaluating process automation and need ROI data; or you operate across multiple channels or geographies with different requirements.
Don't add advanced metrics prematurely - master the fundamentals first. Review enterprise fulfillment solutions if you're at scale. Understand how modern warehouse automation impacts operations when considering advanced metrics. Explore what 3PL automation is for optimization opportunities.
Taking Action on Your 3PL Performance
Effective 3PL management requires clear performance data that drives continuous improvement. The 12 KPIs covered provide a comprehensive framework for measuring and optimizing your fulfillment operations.
Start by identifying which KPIs you're tracking and where you have visibility gaps. Build a weighted scorecard based on your business priorities, establish baseline metrics, and schedule monthly performance reviews. The goal is continuous improvement, not perfection - small gains across multiple KPIs compound into significant competitive advantages.
Ready to optimize your fulfillment with a 3PL partner that welcomes performance tracking and accountability? Partner with Fulfyld for transparent, data-driven fulfillment excellence.
Take Action Today:
- Get started with Fulfyld for performance-focused fulfillment
- Contact us to discuss your KPI tracking needs
- Request a quick quote to see how we compare
- Explore our services and performance guarantees
Frequently Asked Questions
What are the most important 3PL KPIs to track?
Focus on order accuracy (99%+), on-time shipping (95%+), inventory accuracy (99%+), perfect order rate (95%+), and customer satisfaction (90%+). If you can only track three initially, prioritize order accuracy, on-time shipping, and inventory accuracy.
How do you measure 3PL performance?
Use a weighted scorecard tracking 12 KPIs. Assign weights based on business priorities, set industry benchmarks, and conduct monthly reviews. Calculate weighted scores by multiplying each KPI by its weight for an overall performance rating.
What is a good order accuracy rate?
Excellent: 99.5%+ | Good: 98-99.4% | Unacceptable: Below 95%. Top 3PLs achieve high accuracy through barcode scanning, regular training, quality checkpoints, and staff accountability.
How often should you review 3PL KPIs?
Daily for critical metrics, weekly for trend analysis, monthly for comprehensive scorecards, quarterly for deep-dive reviews, and annually for strategic planning and KPI weight adjustments.
What's the difference between KPIs and SLAs?
KPIs measure actual performance; SLAs define contractual minimums with penalties. KPIs verify SLA compliance, and SLAs create accountability for KPI performance.
What is the perfect order rate?
Orders delivered completely, accurately, on time, and damage-free. Excellent: 95%+ | Good: 90-94.9%. Calculate: (perfect orders ÷ total orders) × 100.
How can I reduce the cost per order?
Negotiate volume pricing, optimize packaging for dimensional weight, eliminate unnecessary fees, improve inventory turnover, and bundle orders. Strategic changes can reduce costs 15by -30%.
What causes low inventory accuracy?
Poor receiving processes, inadequate cycle counting, lack of barcode scanning, improper putaway, theft, system errors, and insufficient training. Implement daily cycle counts, barcode scanning, and regular audits.
Should I use one or multiple 3PLs?
Single 3PL: Simpler management, volume discounts, easier integration. Multiple 3PLs: Geographic coverage, risk mitigation, competitive pressure. Most businesses under $5M benefit from single-provider simplicity.
How do I know if my 3PL is underperforming?
Warning signs: Metrics below benchmarks, declining trends, a weighted scorecard below 80%, rising complaints, increasing costs, a lack of transparency, and no improvement despite feedback. Three or more signals warrant serious evaluation.
What technology do I need to track KPIs?
Essential: WMS (warehouse data), TMS (shipping), OMS (order management), and customer feedback platforms. Look for API integrations, real-time dashboards, automated reporting, and cloud-based access.
Can I negotiate pricing based on performance?
Yes. Use KPI data to negotiate performance-based pricing, volume discounts, SLA penalties, and value-added services. Document performance trends and competitive pricing before contract renewals.