Ecommerce businesses lose $1.77 trillion annually due to inventory distortion: 68% from stockouts that drive customers to competitors, and 32% from overstock tying up critical cash flow.
Inventory is simultaneously your most expensive asset and your greatest liability. Small mistakes compound into major losses: a 2% inventory accuracy error translates to thousands in lost revenue, while excess stock drains 20-30% of its value annually in carrying costs.
This guide covers 11 proven inventory methods, essential metrics with formulas, software selection strategies, and 3PL partnership frameworks that transform inventory management from operational burden to competitive advantage.
What Is Ecommerce Inventory Management?

Ecommerce inventory management is the systematic process of sourcing, storing, tracking, and controlling product stock across all sales channels to optimize availability while minimizing carrying costs.
This encompasses everything from raw materials to finished goods, spanning single warehouses to distributed networks.
Core Components:
- Demand forecasting and procurement planning
- Warehouse storage and real-time tracking
- Multi-channel synchronization (website, Amazon, eBay, social)
- Order fulfillment and returns processing
- Comprehensive analytics and reporting
The E-commerce Challenge:
Unlike traditional retail, online businesses face unique pressures. You need real-time synchronization across multiple platforms; customers expect it.
Inventory turnover happens faster. Accuracy requirements are significantly higher since you can’t “check in the back” when an online order fails.
Online stores face an average 8% out-of-stock rate while simultaneously holding 20-30% more merchandise than necessary. Return rates reach 30% compared to retail’s 8-10%, requiring sophisticated reverse logistics.
The challenge isn’t just having inventory; it’s having the right amount in the right place at the right time. Strategic inventory management directly impacts cash flow, customer satisfaction, operating expenses, and profit margins.
Why Ecommerce Inventory Management Matters
Poor inventory management costs retailers globally $1.77 trillion annually, but businesses with optimized systems see 20-30% reductions in carrying costs and 15-25% improvements in stock availability.

The Financial Impact
Optimized inventory management delivers measurable ROI across multiple cost centers, from direct savings to hidden expense reduction.
Direct Cost Savings:
- Reduced carrying costs (storage, insurance, taxes)
- Minimized obsolescence and markdowns
- Lower emergency shipping expenses
- Optimized working capital allocation
- Reduced stockout losses
The hidden costs tell an even more compelling story. Lost sales from stockouts cost retailers $1.2 trillion annually. Excess inventory holding costs average 20-30% of inventory value per year. Emergency replenishment carries 15-40% price premiums.
Consider a $2M annual revenue e-commerce business. With optimized inventory management, you save $60K-$100K in carrying costs, $40K-$80K through stockout prevention, and $20K-$40K in improved cash flow. Total annual impact: $120K-$220K.
Customer Experience & Retention
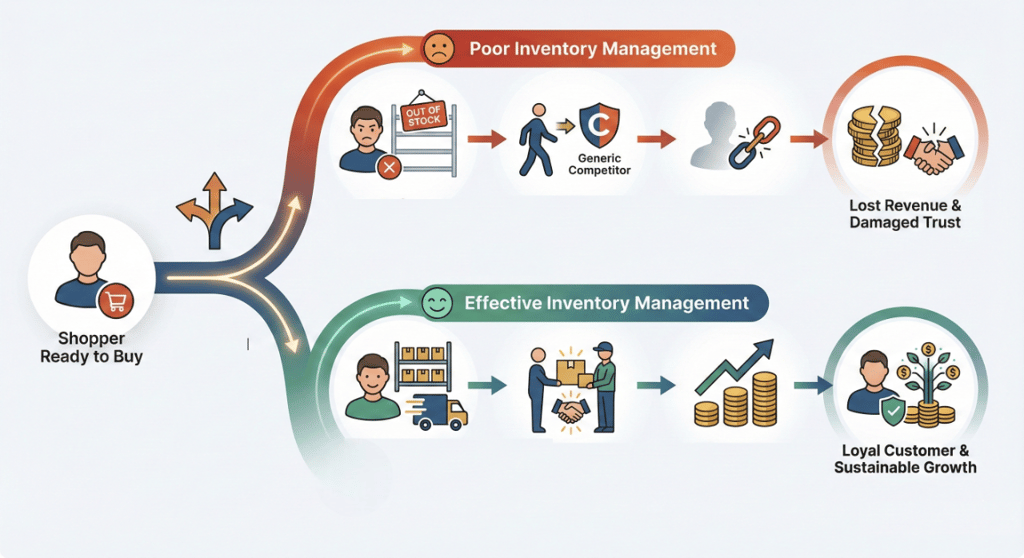
Effective ecommerce inventory management directly shapes customer relationships. Product availability equals trust. Fast fulfillment depends on smart positioning. Accurate stock levels prevent disappointment.
The numbers don’t lie:
- 42% of first-time shoppers won’t return after an out-of-stock experience
- 5% increase in retention generates 25-95% profit increase (Bain & Company)
- 70% of shoppers switch to competitors when facing stockouts
- Same-day or next-day shipping requires inventory proximity
Understanding what poor inventory management leads to helps you avoid these costly mistakes.
Operational Efficiency
Well-managed inventory enables faster order fulfillment through reduced pick times, better warehouse space utilization, improved supplier relationships, reduced labor costs, and data-driven decisions.
Multiple factors affect your inventory efficiency, from supplier reliability to technology integration.
Use our Fulfillment Cost Calculator to quantify your potential savings from optimized inventory practices.
Quick Reference: Inventory Metrics & Formulas
| Metric | Formula | Target Benchmark | Why It Matters |
| Inventory Turnover Ratio | COGS ÷ Average Inventory | 6-12x annually | Indicates sales efficiency and capital tied up |
| Days Inventory Outstanding | (Avg Inventory ÷ COGS) × 365 | 30-60 days | Shows how quickly inventory converts to cash |
| Inventory Accuracy | (Counted Items ÷ System Items) × 100 | 95-99%+ | Prevents stockouts and overstock |
| Stockout Rate | (Stockouts ÷ Total Orders) × 100 | <2-3% | Direct revenue impact |
| Carrying Cost Rate | Total Carrying Costs ÷ Avg Inventory Value × 100 | 20-30% | Total cost of holding stock |
| Economic Order Quantity | √(2 × Demand × Order Cost) ÷ Holding Cost | Varies | Minimizes ordering and holding costs |
| Safety Stock | (Max Daily Sales × Max Lead Time) – (Avg Daily Sales × Avg Lead Time) | Varies | Prevents stockouts during spikes |
| Reorder Point | (Avg Daily Usage × Lead Time) + Safety Stock | Varies | Triggers timely replenishment |
| GMROI | Gross Margin ÷ Average Inventory Cost | 3.0+ excellent | Shows inventory profitability |
| Sell-Through Rate | (Units Sold ÷ Units Received) × 100 | 80%+ ideal | Indicates product demand strength |
Note: Benchmarks vary by industry, business size, and product type. Use our Inventory Turnover Calculator to measure your specific performance.
The 7-Stage Ecommerce Inventory Management Process
Effective ecommerce inventory management follows a seven-stage cyclical process where each stage builds on the previous one, creating continuous optimization.
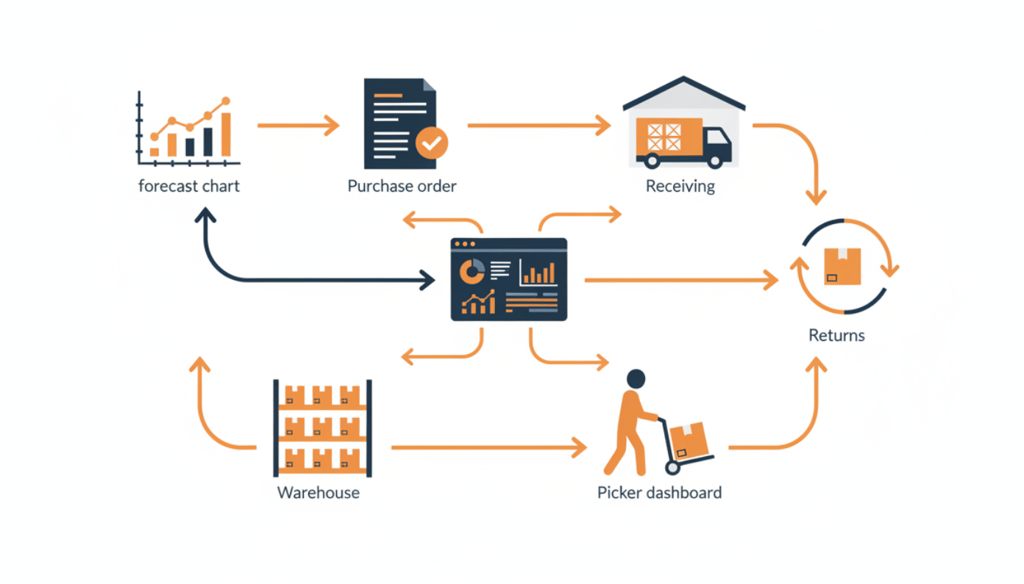
Stage 1: Demand Forecasting
Demand forecasting predicts future inventory needs using historical data, market trends, and business intelligence. Accurate forecasting prevents stockouts and overstock.
Quantitative Methods:
- Historical sales analysis (3+ years by SKU)
- Trend analysis for growth or decline patterns
- Seasonal forecasting for predictable fluctuations
- Moving averages to smooth data
- Exponential smoothing (weights recent data more heavily)

Qualitative Factors:
- Marketing campaigns and promotions
- New product launches
- Market trends and competitor actions
- Economic indicators
- Supply chain disruptions
Best Practices:
Forecast at the SKU level rather than just by category. Update forecasts monthly minimum. Account for seasonality like holidays and back-to-school. Build in a 15-25% buffer for fast-moving products.
Track forecast accuracy with this formula: (1 – |Actual – Forecast| ÷ Actual) × 100. Target 80-90% accuracy for established products.
Common mistakes include relying solely on gut feel, ignoring promotional lift, overlooking seasonal patterns, and using inadequate historical data.
Calculate your current accuracy to establish a baseline for improvement.
Stage 2: Ordering & Procurement
Strategic procurement balances cost efficiency with availability requirements. Effective ordering considers supplier lead times, price breaks, cash flow, and storage capacity.
Economic Order Quantity (EOQ):
Formula: √(2 × Annual Demand × Order Cost) ÷ Holding Cost per Unit
This determines the optimal order size, balancing ordering costs versus holding costs. Works best for predictable demand with stable pricing.
Bulk Ordering:
Advantages: Volume discounts (10-40%), lower per-unit shipping, reduced ordering frequency, better supplier relationships.
Disadvantages: Cash flow impact, increased holding costs, obsolescence risk, and storage space requirements.
Use our calculator to determine your true cost per unit with bulk discounts.
Just-in-Time (JIT) Ordering:
Order only when needed, maintaining minimal inventory. Advantages include reduced carrying costs and improved cash flow. Disadvantages involve stockout risk and dependence on reliable suppliers.
Key Supplier Criteria:
- Lead time consistency (standard deviation <10%)
- Quality control (defect rate <1-2%)
- Pricing stability and transparency
- Communication responsiveness
- Capacity to scale with growth
Maintain 2-3 suppliers for critical items to mitigate risk. Negotiate payment terms like Net 30 or Net 60. Document all agreements.
Lead Time Planning:
- Domestic suppliers: 7-30 days
- International suppliers: 30-120 days
- Build buffers: average lead time + 1 standard deviation
- Factor customs clearance: 7-14 days
Strategic 3PL partners can help optimize your procurement strategy by leveraging their supplier networks and negotiating power to secure better terms and faster lead times for your business.
Stage 3: Receiving & Storage
Accurate receiving and strategic storage form the foundation for all downstream inventory operations. Errors during receiving compound throughout the fulfillment process.
The Receiving Process:
- Pre-notification through Advanced Shipment Notices (ASN)
- Physical inspection with count verification
- Quality checks and damage assessment
- Immediate data entry into your system
- Barcode or RFID scanning for accuracy
- Resolve discrepancies immediately
- Put away in designated storage locations
Accuracy Controls:
- Blind receiving: Count without knowing the expected quantity
- Double-checking: Second person verifies counts
- Photo documentation: Record condition for disputes
- Batch receiving: Process similar items together
- Real-time updates: Immediate inventory availability
Target Metrics:
- 99%+ receiving accuracy
- Dock-to-stock time under 24-48 hours
- Discrepancy rate below 2%
Storage Optimization:
Use ABC analysis for slotting; A-items near packing (20% of SKUs generate 80% of volume). Position FIFO for perishables. Utilize vertical space through pallet racking.
Storage Considerations:
- Environmental controls (temperature, humidity)
- Security measures for high-value items
- Accessibility; fast-movers in easy locations
- Space efficiency (cubic feet, not just square feet)
- Scalability: plan for 30-50% growth capacity
Understanding warehouse shrinkage helps protect your inventory investment from theft, damage, and loss while maintaining accurate stock counts that prevent costly discrepancies.
Learning about warehouse efficiency improvements reduces operational costs through optimized layouts, better processes, and strategic resource allocation that maximizes throughput.
Stage 4: Tracking & Control
Real-time inventory tracking provides visibility into stock levels, locations, and movements, critical for ecommerce inventory management success. Modern real-time tracking prevents overselling and enables data-driven decisions.
Barcode Systems:
Most accessible entry point. Traditional 1D barcodes cost $0.01-$0.05 per label. 2D barcodes (QR codes) provide more data capacity. Handheld scanners range from $100-$500 per unit.
RFID (Radio Frequency Identification):
Advanced tracking option. Passive RFID tags cost $0.10-$0.50 each. Benefits include real-time location tracking and no line-of-sight scanning required. Suits high-volume, high-value operations.
Inventory Management Systems:
Should offer:
- Cloud-based or on-premise options
- Real-time synchronization
- Multi-location visibility
- Comprehensive reporting and analytics
- Strong integration capabilities
Cycle Counting:
Regular partial inventory counts using an ABC approach:
- Count A-items weekly
- Count B-items monthly
- Count C-items quarterly
This identifies systemic issues and maintains accuracy without full shutdowns. Target 95-99% accuracy.
Multi-Location Tracking:
- Real-time visibility across warehouses and 3PLs
- Transfer tracking between locations
- Available-to-promise (ATP) calculations
- Strategic inventory positioning

Use our Inventory Shrinkage Calculator to measure losses. Understand the objective of inventory control systems for better implementation.
Stage 5: Fulfillment & Shipping
Efficient fulfillment transforms inventory into revenue. The fulfillment process must balance speed, accuracy, and cost while coordinating with inventory availability.
Order-to-Cash Flow:
- Order received → Inventory allocation
- Pick list generation → Warehouse pick
- Quality check → Packing
- Shipping label creation → Carrier pickup
- Inventory deduction → System update
- Customer notification → Delivery confirmation
Inventory’s Impact on Fulfillment:
- Stock location affects pick speed
- Inventory accuracy prevents fulfillment errors
- Real-time availability prevents overselling
- Multi-warehouse inventory enables regional fulfillment
- Safety stock ensures consistent availability
Picking Strategies:
Zone Picking: Organize inventory by zones, reduce travel time. Works efficiently for multi-item orders.
Batch Picking: Handle multiple orders simultaneously. Requires organized inventory, maximizes pick efficiency.
Wave Picking: Use scheduled picking sessions. Optimizes labor and shipping cutoffs, coordinates with inventory replenishment.
Target Metrics:
- Order fulfillment time: Under 24 hours for standard orders
- Pick accuracy: 99%+
- Same-day ship rate: 95%+ for orders by cutoff
- Inventory availability: 98%+ during peak periods
Professional pick and pack services improve fulfillment speed through optimized warehouse layouts, trained staff, and systematic processes that reduce errors while increasing throughput capacity.
Learn how to improve shipping efficiency through carrier optimization, packaging strategies, and zone-based shipping methods, and consider 2-day fulfillment capabilities to meet growing customer expectations for faster delivery times.
Stage 6: Returns Management
E-commerce returns average 20-30% of orders compared to retail’s 8-10%, making reverse logistics a critical inventory management component.
Returns Workflow:
- Create a return authorization (RMA)
- Customer ships the item back
- Warehouse receives a return
- Inspection and disposition decision
- Inventory adjustment (restock, liquidate, or dispose)
- Process refund or exchange
Disposition Strategies:
Restocking to Inventory: Establish quality inspection criteria. Define repackaging requirements. Update the system to show available inventory. Target under 2-3 days from receipt to available status.
Liquidation: For damaged or opened items. Partner with liquidation channels to recover 10-40% of the original value. Remove from primary inventory.
Disposal: For defective or unsellable items. Follow proper disposal procedures. Write off from the inventory value. Track disposal reasons for product improvement.
Returns Impact on Inventory:
- Account for expected return rates in planning
- Maintain a higher initial inventory to offset returns
- Recognize seasonal return patterns (post-holiday spike)
- Track returns in transit
- Segregate return inventory during inspection
- Real-time updates upon restocking decisions
Target Metrics:
- Return rate: Track by product, reason, season
- Restocking time: Under 48-72 hours
- Restock rate: % of returns back to available inventory
- Return cost: Processing, shipping, lost value
Professional returns management services streamline this process. Learn about DTC fulfillment returns best practices and explore reverse logistics services.
Stage 7: Reporting & Analysis
Continuous reporting transforms raw inventory data into actionable intelligence, enabling proactive decision-making rather than reactive firefighting.

Daily Reports:
- Current stock levels by SKU
- Stockout alerts (below safety stock)
- Overstock alerts (above maximum threshold)
- Sales velocity by product
- Pending orders and receipts
Weekly Reports:
- Inventory turnover rates
- Slow-moving inventory identification
- Forecast versus actual variance
- Supplier performance metrics
- Multi-location inventory distribution
Monthly Reports:
- Comprehensive inventory valuation
- Carrying cost analysis
- Shrinkage and accuracy reports
- ABC analysis updates
- Demand forecast accuracy reviews
SKU Performance Analysis:
- Rank sales velocity
- Calculate profitability per SKU (GMROI)
- Identify discontinuation candidates
- Track new product performance
- Analyze cannibalization effects
Inventory Health Metrics:
- Aging inventory: 30, 60, 90, 120+ days
- Dead stock identification
- Inventory turnover by category
- Stock coverage: Weeks of supply
Optimization Opportunities:
- Reorder point adjustments
- Safety stock calibration
- EOQ refinements
- Supplier performance improvements
- Warehouse slotting changes
Calculate your metrics, understand what 3PL KPIs to track, and learn how to calculate fulfillment cost per order.
11 Essential Inventory Management Methods
Different products, business models, and growth stages require different inventory approaches. Mastering these 11 methods allows you to select strategies optimized for your specific situation.
Method 1: Just-in-Time (JIT) Inventory
Order inventory only when needed, maintaining minimal stock on hand. Products are ordered and received just before customer orders are fulfilled.
How It Works:
- Suppliers deliver inventory as orders arrive
- Minimal warehouse storage required
- Relies on accurate demand forecasting
- Requires reliable, responsive suppliers
Best For:
- Low-margin products where carrying costs matter
- Businesses with limited warehouse space
- Products with predictable, steady demand
- Strong supplier relationships with fast lead times
Advantages: Reduced carrying costs (20-30% savings), improved cash flow, lower obsolescence risk, reduced warehouse space requirements.
Disadvantages: Stockout risk during demand spikes, dependence on supplier reliability, higher per-unit costs without volume discounts, and vulnerable to supply chain disruptions.
Method 2: Economic Order Quantity (EOQ)
Mathematical model determining the optimal order quantity that minimizes total inventory costs.
Formula: EOQ = √(2 × Annual Demand × Order Cost) ÷ Holding Cost per Unit
How It Works:
Calculate EOQ for each SKU. Order in EOQ quantities. Balance volume discounts versus carrying costs. Reorder when inventory hits the reorder point.
Best For:
Products with predictable, consistent demand, situations where volume discounts are available, and businesses seeking to minimize total inventory costs.
Advantages: Optimizes total cost, provides data-driven decisions, reduces ordering frequency, and takes advantage of volume discounts.
Disadvantages: Assumes constant demand (rarely true), doesn’t account for seasonality, requires accurate cost data.
Calculation Example:
- Annual Demand: 10,000 units
- Order Cost: $100 per order
- Holding Cost: $5 per unit per year
EOQ = √(2 × 10,000 × $100) ÷ $5 = 632 units per order
Method 3: ABC Analysis
Inventory categorization based on the Pareto Principle (80/20 rule), classifying items by revenue contribution or importance.
Classification:
- A-items: Top 20% of SKUs → 80% of revenue (High Priority)
- B-items: Next 30% of SKUs → 15% of revenue (Medium Priority)
- C-items: Remaining 50% of SKUs → 5% of revenue (Low Priority)
How It Works:
- Calculate annual revenue per SKU
- Sort SKUs from highest to lowest revenue
- Calculate the cumulative percentage
- Classify: 0-80% = A, 80-95% = B, 95-100% = C
- Apply differentiated management strategies
A-Items Management:
- Tight inventory control
- Frequent cycle counts (weekly)
- Higher safety stock levels
- Premium storage locations
- Close supplier relationships
- Daily monitoring
B-Items Management:
- Moderate inventory control
- Regular cycle counts (monthly)
- Standard safety stock
- Standard storage locations
- Quarterly reviews
C-Items Management:
- Simple inventory control
- Infrequent cycle counts (quarterly)
- Minimal safety stock or just-in-time
- Bulk orders for cost efficiency
- Annual reviews
- Consider drop-shipping
Method 4: FIFO & LIFO
Inventory flow methods determine which items are sold or used first.
FIFO (First In, First Out):
Oldest inventory sold first. Prevents expiration and obsolescence. Required for perishable goods. GAAP preferred method.
Best For: Perishable products (food, cosmetics, supplements), date-sensitive products with expiration dates, fashion and seasonal items, electronics facing technology obsolescence.
LIFO (Last In, First Out):
Newest inventory sold first. Used primarily for tax purposes. Not accepted under IFRS. Uncommon in physical e-commerce fulfillment.
Implementation Requirements:
- Warehouse layout supporting FIFO flow
- Date tracking on all received inventory
- Pick procedures enforcing FIFO rules
- Staff training on the importance
- WMS configured for FIFO priority
Understanding product flow analysis in a warehouse helps implement FIFO effectively.
Method 5: Safety Stock
Extra inventory is held as a buffer against demand variability and supply chain uncertainty, preventing stockouts during unexpected spikes or delays.
Formula: Safety Stock = (Maximum Daily Sales × Maximum Lead Time) – (Average Daily Sales × Average Lead Time)
Alternative Formula: Safety Stock = Z-score × Standard Deviation of Demand × √Lead Time
Service Level Approach:
- 90% service level: 1.28 Z-score
- 95% service level: 1.65 Z-score
- 99% service level: 2.33 Z-score
Best For: Products with unpredictable demand, long supplier lead times, high-margin products where stockout cost exceeds carrying cost, and seasonal products with short selling windows.
Advantages: Prevents stockouts and lost sales, maintains customer satisfaction, protects against supply chain disruptions, and buffers demand forecast errors.
Disadvantages: Increases carrying costs, ties up working capital, creates obsolescence risk if demand drops.
Calculation Example:
- Maximum Daily Sales: 50 units
- Average Daily Sales: 30 units
- Maximum Lead Time: 20 days
- Average Lead Time: 14 days
Safety Stock = (50 × 20) – (30 × 14) = 1,000 – 420 = 580 units
Method 6: Dropshipping
Fulfill orders directly from the manufacturer or supplier to the customer, eliminating inventory holding entirely. You never physically handle the product.
How It Works:
- Customer orders from your store
- Order transmitted to the supplier
- Supplier ships directly to the customer
- You pay the supplier and keep the margin
Best For: New e-commerce businesses with limited capital, testing new product categories, low-margin commoditized products, and businesses without warehouse capacity.
Advantages: No inventory investment, no warehouse costs, easy to test products, unlimited product selection, minimal operational overhead, and low financial risk.
Disadvantages: Lower profit margins (30-50% less than wholesale), no inventory or quality control, longer shipping times, supplier stockouts you can’t control, and reduced brand differentiation.
Professional ecommerce fulfillment services can help bridge the gap between dropshipping and holding inventory.
Method 7: Batch Tracking
Group inventory by batch or lot numbers, tracking which batch products came from for quality control, recall management, and expiration tracking.
How It Works:
- Assign batch/lot number upon receiving
- Track batch through entire supply chain
- Record batch in all sales
- Trace products back to the source if needed
Best For: Perishable products (food, cosmetics, supplements), regulated products with FDA requirements, products with quality variability, and high-value items requiring traceability.
Advantages: Rapid recall management, quality issue isolation, expiration date tracking, regulatory compliance, and customer safety protection.
Disadvantages: Additional tracking complexity, more detailed record keeping, slightly slower receiving process, and software requirements.
Method 8: Consignment Inventory
Supplier owns the inventory stored in your warehouse until it’s sold. You only pay for inventory when it’s sold to customers.
How It Works:
- Supplier places the inventory at your location
- Supplier maintains ownership
- You sell from consigned stock
- Pay the supplier upon sale
Best For: High-value, slow-moving products, new supplier relationships to test products, cash flow-constrained businesses, seasonal products with uncertain demand.
Advantages: No upfront inventory investment, improved cash flow, reduced inventory risk, and supplier shares risk.
Disadvantages: Not widely available (supplier must agree), requires strong supplier relationships, complex accounting, supplier may pull inventory.
Understanding 3PL providers can sometimes facilitate consignment arrangements.
Method 9: Bulk Shipment
Order and ship inventory in large quantities to maximize volume discounts and reduce per-unit costs.
Best For: High-turnover products that sell through quickly, products with stable demand, long supplier lead times, and situations where significant volume discounts are available.
Advantages: Lower per-unit costs (20-40% discounts), reduced ordering frequency, better supplier relationships, and lower shipping costs per unit.
Disadvantages: Higher carrying costs, cash flow impact, increased obsolescence risk, and storage space requirements.
Method 10: Cross-Docking
Receive inventory and immediately ship to customers without storage, minimizing handling and carrying costs.
How It Works:
- Receive shipment at the dock
- Sort by customer orders
- Immediately reload for outbound shipment
- No long-term storage
Best For: Pre-sold inventory with known orders, fast-moving products, transfers between warehouses, and businesses with limited storage.
Advantages: Reduced handling costs, minimal storage needed, faster delivery times, and lower carrying costs.
Disadvantages: Requires precise coordination, limited flexibility, and is dependent on timing.
Learn about dock scheduling to implement cross-docking efficiently.
Method 11: Cycle Counting
Regular partial inventory counts throughout the year, rather than an annual full physical inventory, maintaining continuous accuracy.
How It Works:
- Count the subset of inventory daily or weekly
- Follow ABC priorities (A-items weekly, B-monthly, C-quarterly)
- Investigate and resolve discrepancies immediately
- Track accuracy metrics
Best For: All e-commerce operations with 100+ SKUs, businesses requiring high inventory accuracy, and operations without the ability to shut down for full counts.
Advantages: Maintains continuous accuracy (95-99%+), identifies systemic issues quickly, requires no operational shutdown, and creates a continuous improvement mindset.
Implementation:
- Establish cycle count schedule (ABC-based)
- Set accuracy targets (95-99%)
- Investigate all discrepancies over 5%
- Track metrics and trends
- Adjust procedures based on findings
Inventory Methods Comparison
| Method | Best For | Cash Flow Impact | Complexity | Risk Level |
| JIT | Low margins, steady demand | Positive | Medium | High |
| EOQ | Predictable demand | Neutral | Low | Low |
| ABC Analysis | 100+ SKUs | Neutral | Low | Low |
| FIFO/LIFO | Perishables | Neutral | Low | Low |
| Safety Stock | Variable demand | Negative | Medium | Low |
| Dropshipping | New businesses | Positive | Low | Medium |
| Batch Tracking | Regulated products | Neutral | High | Low |
| Consignment | High-value items | Positive | High | Low |
| Bulk Shipment | High-turnover | Negative | Low | Medium |
| Cross-Docking | Pre-sold inventory | Neutral | High | Medium |
| Cycle Counting | All operations | Neutral | Medium | Low |
Critical Inventory Metrics & KPIs
Track these essential KPIs to measure inventory health, identify optimization opportunities, and make data-driven decisions.
Core Financial Metrics
The Inventory Turnover Ratio measures how many times inventory is sold and replaced in a period.
Formula: Cost of Goods Sold ÷ Average Inventory
Industry Benchmarks:
- Consumer Electronics: 8-10x annually
- Apparel/Fashion: 6-8x annually
- General Retail: 5-7x annually
- Fast-moving consumer goods: 12-15x annually
Higher turnover equals better cash flow and lower carrying costs. Improve through SKU rationalization, better forecasting, and faster fulfillment.
Gross Margin Return on Investment (GMROI) shows profit generated per dollar invested in inventory.
Formula: Gross Margin ÷ Average Inventory Cost
Targets:
- 3.0+ = Excellent
- 2.0-2.9 = Good
- Under 2.0 = Needs improvement
This reveals which inventory generates profit versus which drains capital. Discontinue products with GMROI under 1.5, double down on those exceeding 4.0.
Carrying Cost Rate represents the annual cost to hold inventory as a percentage of inventory value.
Components:
- Storage costs
- Insurance
- Taxes
- Depreciation
- Obsolescence
- Capital cost
Typical Range: 20-30% of inventory value annually
This reveals the true cost of holding inventory, which is often underestimated.
Calculation Example: $100K inventory × 25% = $25K annual carrying cost.
Operational Metrics
Inventory Accuracy Rate compares physical count to system count.
Formula: (Physical Count ÷ System Count) × 100
Target: 95-99%+ accuracy
This prevents overselling, stockouts, and customer disappointment. Improve through cycle counting, barcode scanning, and receiving controls.
Stockout Rate measures the frequency of out-of-stock situations.
Formula: (Stockouts ÷ Total Orders) × 100
Target: Under 2-3%
Each stockout represents a lost sale plus potential customer churn. Prevent through safety stock, better forecasting, and supplier diversification.
Order Fill Rate tracks complete order fulfillment.
Formula: (Orders Fulfilled Completely ÷ Total Orders) × 100
Target: 95-98%+
Partial shipments frustrate customers and increase costs.
Days Inventory Outstanding (DIO) shows the days to sell the entire inventory.
Formula: (Average Inventory ÷ COGS) × 365 days
Target: 30-60 days (varies by industry)
Lower DIO means faster inventory conversion to cash, improving cash flow.
Planning & Efficiency Metrics
The Sell-Through Rate indicates product demand strength.
Formula: (Units Sold ÷ Units Received) × 100 in period
Targets:
- Seasonal items: 80%+
- Core inventory: 60%+
This identifies winning products versus slow-movers.
Inventory-to-Sales Ratio measures months of supply on hand.
Formula: Inventory Value ÷ Monthly Sales Revenue
Target: 2-3 months of supply
Below 2 signals stockout risk. Above 4 indicates overstock problems.
Lead Time Reliability tracks supplier consistency using the standard deviation of supplier lead times.
Target: Under 10% variation from average
Unreliable lead times require higher safety stock for risk management.
Dashboard & Reporting
Create an inventory health dashboard with:
- Daily updates for critical metrics
- Weekly updates for planning metrics
- Red/yellow/green indicators for quick assessment
- Trend lines showing month-over-month changes
- Alerts for metrics outside acceptable ranges
- Drill-down capability to the SKU level
Share dashboards cross-functionally with operations, finance, and marketing teams.
Multi-Channel Inventory Management
Modern ecommerce brands sell across 3-5+ channels simultaneously: website, Amazon, eBay, social commerce, wholesale, and retail. Multi-channel synchronization prevents overselling while maximizing reach and revenue.
The Multi-Channel Challenge
Complexity factors multiply quickly:
- Each platform operates independently
- Real-time synchronization requirements are critical
- Different fulfillment expectations exist by channel
- Varying fee structures affect profitability
- Channel-specific packaging requirements
- Multiple inventory pools (FBA, 3PL, in-house) need coordination
The Cost of Poor Synchronization:
Overselling happens when you sell a product on Channel A after Channel B sold the last unit. This leads to customer disappointment, cancellations, and channel penalties like Amazon suppressing listings for stockouts.
Lost sales from excessive buffers create unnecessary safety stock per channel. Manual reconciliation consumes hours daily.
Industry reality: Businesses selling on 3+ channels without centralized inventory management lose 5-15% of potential revenue to stockouts, overselling, or excessive safety stock.
Centralized Inventory Management
Establish a single source of truth for inventory across all channels with real-time synchronization, preventing overselling.
Technology Requirements:
- Multi-channel inventory management software
- API integrations with each sales channel
- Real-time stock updates (sub-60 second sync)
- Centralized order management system (OMS)
- Automated allocation rules
Implementation Approach:
Start with a centralized inventory pool where all available inventory exists in a single system. Use real-time allocation to channels with dynamic reallocation based on performance.
Set channel rules, including minimum stock by channel and maximum allocation percentages.
Channel-Specific Strategies
Amazon FBA:
- Dedicated FBA inventory with Amazon fulfilling orders
- Longer replenishment cycles for inbound receiving time
- Consider Multi-Channel Fulfillment (MCF) for other channels
Your Own Website:
- Real-time inventory that you control
- Fastest updates and the most flexibility
Marketplaces (eBay, Etsy):
- API synchronization required
- Buffer stock for sync delays (5-10 units)
- Monitor channel-specific metrics
Wholesale and B2B:
- Separate allocation or shared pools
- Minimum order quantities
- Clear lead time communication
Safety Stock Strategies
Centralized Safety Stock: Single safety stock pool serving all channels. Most capital-efficient but requires excellent synchronization.
Channel-Specific Buffers: Maintain small buffers per channel (5-10 units) to protect against sync delays. Costs more but reduces risk.
Inventory Allocation Strategies
Dynamic Allocation adjusts inventory based on channel performance, not fixed percentages.
Allocation Approach:
- Allocate based on high-converting channels
- Adjust allocation daily or weekly
- Consider profit margins by channel
- Account for fulfillment speed requirements
Allocation Formula Example:
Channel Allocation % = (Channel Sales Velocity × Channel Margin) ÷ Total Weighted Performance
Practical Application:
- Website: 60% (highest margin, direct relationship)
- Amazon: 30% (high volume, lower margin, FBA fees)
- eBay and others: 10% (test channels, lower volume)
Reserve 10-15% of inventory for new customer acquisition to prevent existing channels from consuming all stock.
Technology Evaluation
Select multi-channel inventory software that provides real-time synchronization, robust integrations, and scalability for future channel expansion.
Essential Features:
- Real-time sync (under 60 seconds)
- Support for your specific channels
- Automated reorder triggers
- Reporting by channel
- Centralized order management
- Bulk listing management
- Price synchronization
- Low stock alerts by channel
Top Considerations:
- Integration quality (native API versus manual)
- Sync frequency and reliability
- Scalability for channel additions
- Cost structure (per channel, per transaction, flat fee)
- Support quality and documentation
Professional omnichannel fulfillment services manage this complexity. Advanced Shopify fulfillment integration streamlines operations. Explore available integrations.
Ecommerce Inventory Management Software: Types & Features
The right software can transform manual chaos into automated efficiency. Selecting the right solution requires understanding your needs, evaluating features systematically, and calculating the true total cost of ownership.
With 100+ options available, a strategic evaluation framework prevents expensive mistakes.
Software Types & Categories
Different business sizes and complexities require different software approaches. Understanding which category fits your needs prevents overspending on unnecessary features or choosing a solution you’ll quickly outgrow.
Let’s break down the four main software categories and when each makes sense.

Basic Systems ($50-$150/Month)
Work for startups and small operations with straightforward needs. These handle under 50 SKUs across single channels for businesses under $500K revenue:
- Essential tracking with manual reorders
- Simple reporting dashboards
- Single-location inventory management
- Examples: inFlow, Zoho Inventory, Sortly
- Limited by manual processes and basic features
Pro Tip: If you’re processing under 100 orders monthly and selling on one channel, basic systems provide everything you need without overwhelming complexity. Upgrade when you hit 200+ orders or add a second sales channel.
Advanced Systems ($200-$500/Month)
Target growing businesses managing 50-500 SKUs across 2-3 channels with $500K-$5M revenue. These solutions offer automation that saves hours daily:
- Real-time synchronization across sales channels
- Demand forecasting based on historical data
- Purchase order automation with supplier integration
- Advanced reporting and analytics dashboards
- Multi-location inventory tracking capabilities
- Examples: Cin7, Skubana, Brightpearl
This tier represents the sweet spot for most e-commerce businesses experiencing growth. Accurate inventory forecasting becomes critical at this stage to prevent stockouts while optimizing cash flow. The automation ROI typically pays for the software within 2-3 months through time savings and reduced stockout costs.
Enterprise ERP Systems ($1,000-$10,000+/Month)
Unify entire business operations for companies with 500+ SKUs, 5+ channels, and $5M+ revenue. NetSuite, SAP, and Microsoft Dynamics integrate inventory with accounting, CRM, HR, and all business functions:
- Complete operational unification across departments
- Customizable workflows for complex processes
- Robust reporting across the entire business
- Dedicated implementation teams
- Long-term vendor relationships
Important Note: ERP implementation takes 3-6 months minimum. Only consider this level when you have dedicated IT resources and complex operational requirements that justify the investment.
Specialized Solutions
Serve specific niches with purpose-built features. Understanding 3PL software helps evaluate providers like Fulfyld, ShipBob, and ShipMonk offering integrated fulfillment plus inventory management:
- Warehouse Management Systems (WMS) for pure logistics
- 3PL-integrated platforms for outsourced fulfillment
- E-commerce platform built-ins (Shopify, BigCommerce)
- Industry-specific solutions (food service, manufacturing)
Choose specialized solutions when your industry or business model has unique requirements that general inventory systems don’t address well. For example, food businesses need expiration tracking that fashion retailers don’t require.
Essential Features Evaluation
Evaluate inventory software systematically by assessing core functionality, advanced capabilities, and integration requirements before making decisions. Every feature sounds great in a sales demo, but focus on what you’ll actually use daily.
Here’s how to separate must-haves from nice-to-haves.
Core Functionality Requirements
Your baseline requirements that every inventory system should provide. Multi-channel inventory synchronization prevents overselling across platforms while real-time stock updates provide accurate availability:
- Low stock alerts trigger timely reordering
- Purchase order management streamlines procurement
- Comprehensive reporting and analytics tools
- Barcode and SKU management systems
- Order management integration with sales platforms
- Mobile access for on-the-go visibility
Without these foundational features, you’ll spend hours on manual workarounds. Barcode scanning technologies greatly improve data accuracy by eliminating manual entry errors.
For example, without real-time synchronization, you risk selling the same item twice on different channels, creating customer service nightmares and potential refunds.
Advanced Capabilities for Growth
Separate good systems from great ones that scale with your growth. Demand forecasting predicts future needs based on patterns, while automated reorder points trigger purchases when thresholds are hit:
- Lot and batch tracking for expiration management
- FIFO/LIFO support for proper inventory flow
- Cycle counting tools for continuous accuracy
- ABC analysis for strategic inventory segmentation
- Landed cost calculations, including duties and freight
- Multi-location inventory tracking spans distributed operations
Pro Tip: Don’t pay for advanced features you won’t use within 6 months. If you’re not tracking expiration dates now, skip lot tracking initially. You can upgrade later when your needs expand.
Integration Capabilities
Determine daily workflow efficiency and prevent data silos. Your software must connect seamlessly with the platforms you use every day:
- E-commerce platforms: Shopify, WooCommerce, BigCommerce, Magento
- Marketplaces: Amazon, eBay, Etsy, Walmart
- Shipping carriers: FedEx, UPS, USPS
- Accounting software: QuickBooks, Xero, NetSuite
- 3PL/fulfillment partner systems
- CRM platforms and payment processors
Poor integration creates manual work and errors. A business owner I worked with manually exported/imported data between systems three times daily, wasting 90 minutes each day that automation could eliminate completely.
Understanding fulfillment services helps you evaluate which integrations matter most for your operations.
User Experience & Adoption
Affect adoption and efficiency across your entire team. An intuitive interface requires minimal training, reducing onboarding time and resistance:
- Mobile app functionality enables warehouse staff efficiency
- Dashboard and report customization tracks what matters most
- Bulk operations support speeds up common tasks
- User role management protects sensitive data
- Keyboard shortcuts for power users
Real Example: One client’s warehouse staff refused to use their old system because it required 8 clicks to receive inventory. After switching to software with barcode scanning, receiving time dropped from 15 minutes per shipment to 3 minutes, and staff adoption hit 100% within one week.
Support & Reliability
Protect your investment when things go wrong. Evaluate customer support hours and response quality (24/7 or business hours only?), implementation and onboarding assistance, and documentation quality:
- System uptime guarantees (demand 99%+)
- Data backup and security measures
- Migration support from your current system
- Active user community or forums
- Regular software updates and improvements
Check review sites like G2 and Capterra for honest feedback about support quality. A cheap system with poor support becomes expensive when you can’t get help during critical moments like peak season or system errors.
How to Select Inventory Management Software
Understanding software options is just the beginning. Smart selection requires analyzing costs comprehensively and following a structured evaluation process.
Below, we walk you through calculating true ROI and executing an 8-week selection timeline that prevents expensive mistakes.
Cost Analysis Framework
Understanding the true cost of inventory software goes far beyond the monthly subscription price. Many businesses are surprised by hidden costs that double or triple their expected expenses. Calculate the Total Cost of Ownership (TCO) before committing to prevent budget overruns.

Total Cost of Ownership (TCO)
Reveals true expenses beyond the advertised price. Monthly or annual software fees represent just the starting point:
- Base subscription fees
- Per-user charges (can add $20-50 per user monthly)
- Transaction fees (typically $0.05-0.25 per order)
- Channel connection costs ($10-50 per channel)
- Storage or data fees (charged by GB or records)
- Implementation and setup costs ($500-$5,000+)
- Data migration complexity ($1,000-$10,000 for large catalogs)
- Staff training time and materials
- Custom integrations ($2,000-$20,000 each)
Hidden ongoing costs emerge from additional user licenses as teams grow, increased transaction volume tiers, premium support fees, API overage charges, and system upgrade fees.
Real Example: A $200/month system became $650/month after adding 5 users ($150), 3 sales channels ($90), processing 5,000 orders ($125), and premium support ($85).
ROI Calculation
Justifies your investment with quantifiable benefits. Calculate labor savings by multiplying hours saved weekly by the hourly rate:
- Labor savings: If automation saves 10 hours/week × $25/hour = $1,000/month
- Reduced stockouts: Capturing even $2,000/month in previously lost sales
- Lower carrying costs: $500/month saved from optimized stock levels
- Fewer errors: Preventing $300/month in losses from accuracy issues
- Total Monthly Benefit: $3,800 – Software Cost: $400 = Net ROI: $3,400/month
Calculate Payback Period by dividing the total implementation cost by net monthly ROI. In this example, a $5,000 implementation cost ÷ $3,400 monthly ROI = 1.5 months to break even. Any payback period under 6 months represents an excellent investment.
8-Week Software Selection Process
A structured selection process prevents expensive mistakes and ensures you choose software that actually fits your needs. Rushing this decision often leads to buyer’s remorse and costly system switches within 12 months. Follow this proven timeline for confident selection.
Week 1: Requirements Documentation
Start by documenting your current pain points that cause the most friction. List must-have features versus nice-to-haves and identify integration needs for existing systems:
- Set realistic budget parameters, including implementation
- Define success criteria for measuring the decision
- Involve stakeholders from operations, finance, and IT
- Document current inventory workflows that need improvement
Example: Create a spreadsheet listing “Critical,” “Important,” and “Nice to Have” features. Rank each potential solution against these criteria. This prevents sales demos from swaying you toward features you don’t actually need.
Week 2: Market Research
Identify 5-7 potential solutions matching your requirements. Read user reviews on G2 and Capterra for real-world experiences:
- Check integration capabilities thoroughly
- Compare pricing structures, including hidden costs
- Request product demos from shortlisted vendors
- Join user forums to ask current customers questions
Pro Tip: Pay attention to reviews from businesses similar to yours in size and industry. A system perfect for enterprise retail might overwhelm a small DTC brand, even if reviews are glowing.
Weeks 3-4: Demo and Evaluation
Schedule demos with your top 3-4 options, bringing cross-functional team members from operations, IT, and finance. Test with your real scenarios and data:
- Evaluate ease of use with actual end-users (not just managers)
- Ask about implementation timelines and support
- Request references from similar-sized businesses
- Clarify all pricing, including hidden fees
Critical Question to Ask: “Walk me through how we’d handle [your most complex workflow] in your system.” Generic demos look great, but your specific use case reveals where systems fall short.
Weeks 5-6: Trial Periods
Execute free trials or pilots with your top choice. Test with a subset of inventory (50-100 SKUs) to minimize risk:
- Involve actual end-users in daily testing
- Measure time savings and efficiency gains
- Identify implementation challenges early
- Test customer support responsiveness during trial
Run parallel systems during trials so you have a backup if the new system fails. This adds safety without disrupting operations.
Weeks 7-8: Final Decision and Implementation
Make a selection based on a comprehensive evaluation, not just features or price. Negotiate contract terms and pricing:
- Plan a detailed implementation timeline with milestones
- Assign an internal project owner with clear responsibility
- Schedule training sessions for all users
- Set a realistic go-live date with buffer time
Success Metric: Aim for 80%+ user adoption within 30 days of launch. If adoption is lower, address usability issues immediately before they become permanent resistance.
Common Selection Mistakes to Avoid
Don’t let these errors derail your implementation:
- Choosing the cheapest option without evaluating features = outgrow quickly
- Ignoring integration requirements = daily manual work pain
- Underestimating implementation time = rushed, error-prone launch
- Not involving end-users = poor adoption and resistance
- Failing to plan for growth = need to switch systems in 12-18 months
Final Pro Tip: Negotiate annual contracts instead of multi-year commitments initially. This gives you an exit if the system doesn’t work out, providing leverage for renewal negotiations once you’ve proven the value.
Explore modern 3PL automation capabilities when evaluating software. Learn about 3PL warehouse management systems to understand fulfillment technology.
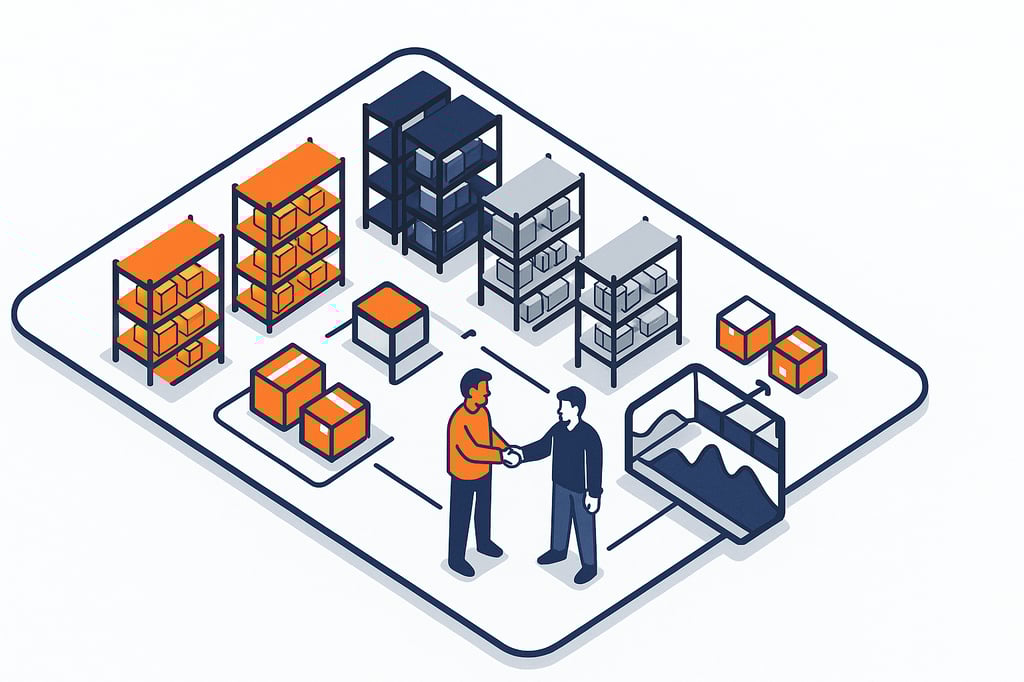
3PL Partnership for Inventory Optimization
Strategic 3PL partnerships transform ecommerce inventory management from an internal burden to a competitive advantage. Professional fulfillment providers deliver technology, infrastructure, and expertise that most brands can’t justify building in-house, creating operational leverage that scales with your growth.
How 3PLs Optimize Inventory Management
Professional fulfillment providers offer four key advantages that most businesses can’t replicate internally: distributed networks, advanced technology, inventory expertise, and scalable capacity.
Distributed Inventory Networks
Multiple fulfillment centers across the East and West coasts create strategic positioning near major customer populations. This network approach reduces shipping costs by 20-40% while enabling 2-day ground shipping to 95%+ of the US:
- Analyze order density by geography to identify optimal locations
- Split inventory across 2-3 strategic fulfillment centers
- Reduce average shipping costs through zone optimization
- Enable faster delivery promises that meet customer expectations
Understanding warehouse efficiency improvements becomes crucial when managing inventory across multiple locations to maximize operational performance.

Advanced Technology Infrastructure
Professional 3PLs provide Warehouse Management Systems (WMS), real-time inventory visibility, seamless e-commerce integration, and automated reorder alerts. These systems typically cost $50K-$500K to implement in-house but come included as part of 3PL service with continuous updates and no IT maintenance burden.
Modern 3PL warehouse management systems eliminate capital investment barriers while providing enterprise-grade capabilities that scale with your business.
Inventory Management Expertise
Experienced inventory planners understand seasonal patterns and demand fluctuations. They provide:
- Demand forecasting support using sophisticated models
- Reorder point optimization based on historical performance
- Supplier coordination leveraging established relationships
- Safety stock recommendations balancing cost versus risk
This expertise prevents costly mistakes while accelerating optimization. 3PL responsibilities include proactive inventory planning that supplements your team’s capabilities.
Scalable Capacity & Shared Services
Flexible warehouse space grows or shrinks with demand without long-term lease commitments. 3PLs negotiate carrier rates from volume across all clients, maintain optimized receiving processes, ensure professional cycle counting (99%+ accuracy), and handle returns management efficiently.
When to Partner with a 3PL
Strategic timing maximizes partnership value. Consider both operational indicators and financial realities when evaluating readiness.
Order Volume & Revenue Milestones
Partnership makes sense when you reach:
- 500+ monthly orders with consistent growth
- $500K+ annual revenue demonstrating sustainability
- Multiple sales channels requiring synchronized inventory
- Month-over-month growth patterns indicate scale
Operational Warning Signs
Internal fulfillment hits limits when:
- Outgrowing current warehouse space or constantly reorganizing
- Recruiting and training warehouse staff consumes excessive time
- Inventory management overwhelms leadership attention
- Unable to expand to additional sales channels
- Current setup can’t provide faster shipping customers demand
- Returns processing creates bottlenecks
Learning how 3PL partners help reduce inventory levels addresses many of these operational challenges through better inventory positioning and forecasting.
Cost Comparison: In-House vs. 3PL
In-house fulfillment requires fixed costs:
- Warehouse lease: $5K-$20K/month
- Staff: $40K-$60K per employee × 2-5 employees
- WMS software: $500-$2K/month
- Equipment: $10K-$50K upfront
- Total: $10K-$40K+/month (fixed, regardless of volume)
3PL fulfillment uses variable pricing:
- Per-order fulfillment: $5-$12/order
- Storage: $5-$15/pallet/month
- Scales directly with volume, protecting cash flow
Evaluating 3PL Inventory Capabilities
Choose partners based on technology, inventory practices, network capacity, and communication quality. Proper evaluation prevents costly partnership mistakes.
Technology & Integration Requirements
Evaluate WMS capabilities, real-time inventory visibility across locations, API integration quality with your platforms, and reporting depth. Understanding what 3PL software is helps you assess whether a provider’s technology meets your needs.
Inventory Management Practices
Demand 99%+ receiving accuracy, regular cycle counting, FIFO and batch tracking capabilities, flexible safety stock management, and returns processing SLAs. These practices reveal operational excellence and protect your brand.
Network & Capacity Assessment
Assess fulfillment center locations, available storage capacity for growth, scalability for peak season surges, and geographic coverage matching your customer base. 3PL automation capabilities determine how efficiently they can handle volume fluctuations.
Communication & Support
Successful partnerships require dedicated account managers, inventory planning support, demand forecasting assistance, regular business reviews, and proactive issue identification.
Red Flags to Avoid:
- Lack of real-time inventory visibility
- Poor integration capabilities are forcing manual workarounds
- No cycle counting program
- Resistance to distributed inventory
- Inflexible capacity
- Limited reporting capabilities
Implementation Roadmap
Structured implementation over 6 months ensures a smooth transition and optimization. Follow this proven three-phase approach.
Phase 1: Initial Setup (Weeks 1-4)
Complete system integration and thorough testing. Transfer initial inventory with careful reconciliation. Train your team on 3PL systems and establish clear communication protocols with defined responsibilities.
Phase 2: Optimization (Months 2-3)
Analyze inventory positioning based on actual order data. Adjust reorder points using performance insights. Optimize safety stock levels balancing cost and risk. Implement regular business reviews, tracking KPIs.
Phase 3: Scaling (Months 4-6)
Add additional fulfillment locations strategically. Expand to new sales channels confidently. Implement advanced forecasting tools. Optimize inventory mix based on profitability through continuous improvement initiatives.
Learn about the advantages of hiring a 3PL for comprehensive benefits. Review our 3PL comparison guide for selection criteria. Explore inventory fulfillment services options. Get started with Fulfyld to transform your inventory management.
Common Inventory Challenges & Solutions
Every e-commerce business faces inventory challenges. The difference between success and struggle is having proven solutions ready before problems spiral into crises.
These seven challenges represent the most common pain points, along with actionable solutions you can implement immediately.
Challenge 1: Stockouts & Lost Sales
Running out of inventory during demand periods creates lost sales, disappointed customers, and a competitive disadvantage. Stockouts generate $1.2 trillion in annual losses globally from customers switching to competitors.
Mastering intermittent demand forecasting helps businesses predict and prevent unexpected stockouts by understanding sporadic demand patterns.
Immediate Solutions (Week 1):
- Set up low-stock alerts to trigger reorders at a 2-week supply
- Identify alternative suppliers for critical items
- Implement backorder capability with clear customer communication
- Use “notify when available” email capture to retain interested buyers
Short-Term Fixes (Months 1-2):
- Calculate proper safety stock levels using demand variability
- Improve demand forecasting accuracy with historical analysis
- Establish reorder point formulas based on lead times
- Build supplier relationships for expedited order capabilities
Long-Term Strategy (Months 3-6):
- Implement advanced forecasting software with ML capabilities
- Diversify supplier base (2-3 suppliers per critical item)
- Partner with 3PL for distributed inventory positioning
- Create demand sensing capabilities for real-time adjustments
Challenge 2: Overstock & Dead Inventory
Excessive inventory ties up capital, consumes warehouse space, and risks obsolescence. The true cost reaches 20-30% of inventory value annually through storage, insurance, and depreciation.
Understanding how to sell overstock apparel provides strategies for recovering value from excess inventory through specialized channels.
Immediate Actions:
- Identify inventory aged 90+ days using inventory reports
- Run promotional discounts (20-40% off) to clear aging stock
- Bundle slow-movers with best-sellers to increase movement
- Consider liquidation channels to recover 10-30% of value
Preventative Measures:
- Implement ABC analysis using the 80/20 rule
- Calculate EOQ properly for optimal order quantities
- Use data-driven forecasting instead of gut feel
- Set maximum inventory limits per SKU
- Conduct regular SKU rationalization (quarterly reviews)
- Monitor the inventory turnover ratio closely
Strategic Approach:
- Use just-in-time ordering for slow-moving C-items
- Dropship low-volume items entirely to eliminate holding
- Place smaller, more frequent orders to test demand
- Test new products in small batches before scaling
Challenge 3: Inaccurate Inventory Counts
Discrepancies between recorded and actual inventory create overselling situations, stockouts, and customer dissatisfaction. Inaccuracies compound over time, eroding trust in inventory data and order fulfillment reliability.
Implementing sheet-to-floor inventory counting methodologies helps verify accuracy by comparing physical counts to recorded data systematically.
Solutions:
- Implement cycle counting program (weekly for A-items, monthly for B-items, quarterly for C-items)
- Use barcode scanning for all transactions to eliminate manual entry errors
- Investigate discrepancies immediately when counts don’t match
- Improve warehouse security with cameras and access controls
- Implement better receiving procedures with blind counts and verification
- Ensure real-time inventory updates across all systems
Challenge 4: Multi-Channel Overselling
Selling across multiple channels without proper synchronization creates overselling nightmares. The same unit gets sold twice, forcing order cancellations and damaging customer relationships across platforms.
Modern multi-channel fulfillment solutions provide real-time inventory updates and automated order syncing to prevent overselling across sales platforms.
Solutions:
- Deploy a centralized inventory management system as single source of truth
- Ensure real-time synchronization (under 60 seconds) across all channels
- Maintain channel-specific buffers (5-10 units) to absorb sync delays
- Create automated stock allocation rules based on channel performance
- Monitor sync regularly and set up alerts for failures
- Use conservative availability (sell 90% of actual stock to build buffer)
Challenge 5: Poor Supplier Performance
Unreliable suppliers disrupt inventory planning through late deliveries, quality issues, and unpredictable lead times. This forces reactive management instead of strategic planning and inventory optimization.
Learning how to calculate replenishment cycles helps you set realistic reorder points by accounting for supplier lead time variability.
Solutions:
- Track supplier KPIs rigorously (on-time percentage, quality rate, lead time consistency)
- Diversify suppliers with 2-3 sources per critical item
- Build lead time buffers (average lead time + 1 standard deviation)
- Negotiate performance guarantees with penalty clauses
- Conduct regular supplier performance reviews (quarterly)
- Develop backup supplier relationships before emergencies
- Consider the domestic vs international mix for risk management
Challenge 6: Seasonal Demand Variability
Dramatic demand swings create impossible balancing acts between stockouts during peaks and excess inventory post-season. This challenge intensifies for products with pronounced seasonality patterns.
The Q4 surge is where inventory strategy stops being theoretical — safety stock, replenishment timing, and SKU prioritization all get tested at once. Our peak season fulfillment playbook covers the operational moves that turn that pressure into a finite, plannable problem.
Specialized holiday fulfillment services provide scalable capacity during peak seasons without permanent warehouse commitments or long-term leases.
Solutions:
- Conduct historical seasonality analysis to identify patterns
- Increase safety stock by 30-50% in pre-season months
- Negotiate flexible supplier agreements for rush orders
- Partner with 3PL for scalable capacity during peaks
- Gradually reduce inventory post-season to avoid excess
- Implement a markdown strategy for seasonal clearance
Challenge 7: High Carrying Costs
Inventory holding costs silently drain profitability at 20-30% of inventory value annually through storage, insurance, taxes, and obsolescence. Most businesses only track purchase price, ignoring the total cost of ownership.
Using a comprehensive warehouse cost calculator reveals true inventory carrying costs, including hidden expenses like utilities and labor.
Solutions:
- Reduce average inventory levels through just-in-time strategies
- Improve the inventory turnover ratio to move products faster
- Discontinue slow-movers that tie up capital
- Negotiate better storage rates with warehouses
- Optimize warehouse layout for maximum space efficiency
- Partner with 3PL for a variable cost model instead of fixed leases
- Calculate the true carrying cost when making purchasing decisions
Advanced Inventory Optimization
Beyond fundamentals, advanced optimization techniques leverage data analytics and strategic positioning to extract maximum efficiency from every inventory dollar. These methods deliver measurable improvements in accuracy, cost reduction, and operational performance.

Predictive Analytics & Machine Learning
Advanced forecasting moves beyond historical averages to sophisticated pattern recognition. Machine learning algorithms analyze complex patterns across variables, incorporating external factors like weather, economic indicators, and market trends for continuous improvement.
Key Benefits:
- 10-25% improvement in forecast accuracy reduces safety stock needs
- Reduced safety stock requirements to free up working capital
- Better promotional planning prevents stockouts and overstock
- Proactive inventory positioning prevents expedited shipping costs
Pro Tip: Start with high-volume A-items where accuracy improvements deliver immediate ROI. Collect 2+ years of granular sales data by SKU and channel, then gradually expand to more SKUs as confidence grows.
Dynamic Safety Stock Calculation
Traditional safety stock formulas use static averages that don’t reflect real-world variability. Dynamic approaches adjust continuously based on demand patterns, supplier performance, seasonal trends, and product lifecycle stage.
Understanding buffer inventory strategies helps businesses implement flexible safety stock that responds to market conditions without tying up excessive capital.
Adjustment Triggers:
- Increase during supply chain disruptions or market volatility
- Decrease for stable mature products with predictable patterns
- Consider product lifecycle (new products need higher buffers)
- Review monthly to stay responsive without excessive churn
Result: Expect 15-30% reduction in safety stock capital while maintaining or improving service levels. This frees significant working capital for growth initiatives.
Network Inventory Optimization
Multi-location strategy transforms shipping economics through geographic intelligence. Position inventory strategically across 2-4 locations, matching customer concentrations to reduce shipping costs and delivery times.
Strategic Allocation:
- Place high-velocity items in all locations for maximum availability
- Position medium-velocity items regionally based on demand concentration
- Centralize low-velocity items to reduce inventory investment
- Implement dynamic reallocation between locations based on performance
Pro Tip: Analyze your order data by ZIP code to identify natural geographic clusters. If 40%+ of orders come from specific regions, those areas justify dedicated fulfillment centers for 20-40% shipping cost reductions.
SKU Rationalization & Portfolio Optimization
Data-driven SKU management eliminates emotion from difficult product decisions. Calculate GMROI (Gross Margin Return on Investment) for every SKU to identify profitability objectively and focus resources where they matter most.
Implementing effective SKU rationalization best practices simplifies operations by systematically identifying and removing underperforming products that drain resources.
Discontinuation Criteria:
- GMROI under 1.5 that drains capital without returns
- No sales in 90 days unless strategic
- Return rates exceeding 20% that damage profitability
- Negative contribution margin after all costs
- Inferior items when superior alternatives exist
Process: Conduct quarterly SKU performance reviews using data, not opinions. Identify discontinuation candidates objectively, create clearance strategies to minimize write-offs, and communicate plans with suppliers early.
Continuous Improvement Framework
Ongoing optimization requires structured review cycles that catch problems early and capitalize on opportunities. Regular cadence ensures your system evolves with your business rather than becoming stagnant.
Review Cadence:
- Weekly: Track key metrics (turnover, stockout rate, accuracy)
- Monthly: Analyze performance trends and adjust reorder points
- Quarterly: Conduct SKU rationalization and supplier reviews
- Annually: Strategic planning and technology roadmap updates
Pro Tip: Schedule reviews at the same time each period to build a routine. Use a standard template that tracks metrics over time, making trends immediately visible and actionable.
Making Inventory Management Your Competitive Edge
Ecommerce inventory management isn’t just an operational necessity; it’s a strategic advantage. Businesses with optimized inventory systems see 20-30% reductions in carrying costs, 15-25% improvements in stock availability, and significantly improved cash flow.
Success requires commitment to fundamentals: accurate demand forecasting, proper inventory methods, real-time tracking, and continuous measurement. As you scale, advance to predictive analytics, dynamic safety stock, network optimization, and strategic 3PL partnerships.
Ready to transform your inventory management? Fulfyld combines advanced technology, distributed fulfillment networks, and expert optimization support to turn inventory into a competitive advantage.
Request a Quote | View Pricing
Frequently Asked Questions
How long does it take to implement proper inventory management?
Basic setup takes 2-4 weeks; full optimization requires 3-6 months, including software integration, process training, and workflow refinement.
When will I see ROI from inventory management improvements?
Most businesses see measurable ROI within 60-90 days through reduced stockouts, lower carrying costs, and improved cash flow.
At what revenue should I switch from spreadsheets to software?
At $250K annual revenue or 200+ monthly orders, spreadsheets become error-prone. Software prevents costly mistakes at this scale.
What inventory accuracy percentage should I target?
Target 95% minimum for basic operations, 98%+ for mature businesses. Below 95% indicates serious counting or tracking issues.
What’s a realistic inventory software budget for small businesses?
Expect $100-300/month for businesses under $1M revenue. Includes software ($50-150) plus implementation support and training costs.