How the Days Sales of Inventory Formula Works

The DSI formula is straightforward:
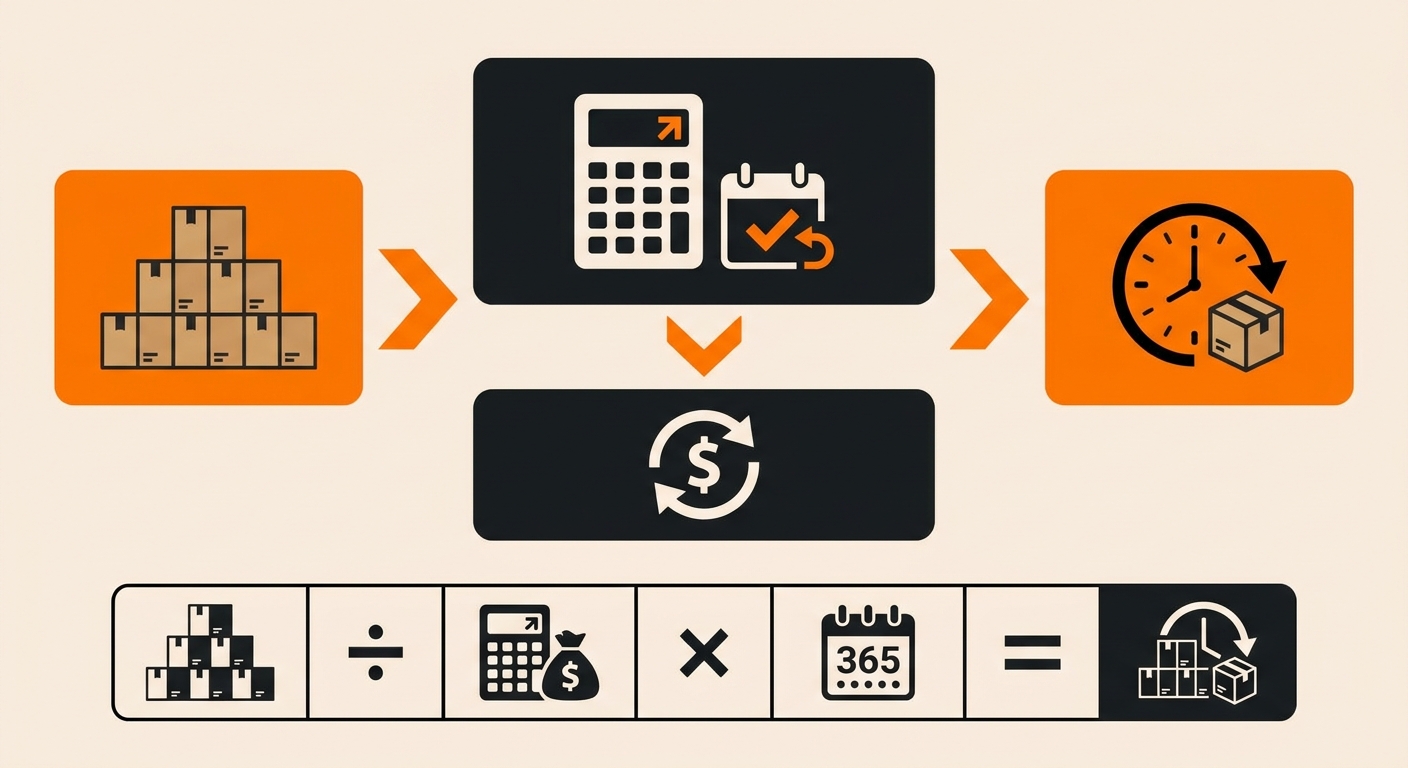
DSI = (Average Inventory ÷ Cost of Goods Sold) × Number of Days
For most calculations, the number of days used is either 365 (annual) or 90 (quarterly), depending on the reporting period.
Here’s a quick example: if a brand holds $200,000 in average inventory and records $1,000,000 in COGS over a year, its DSI is 73 days. That means it takes roughly two and a half months to turn over its entire stock.
Average inventory is typically calculated as the sum of beginning and ending inventory divided by two. Using an average, rather than a snapshot, smooths out seasonal spikes and gives a more accurate picture of how inventory behaves over time.
What a Good DSI Looks Like by Industry
DSI benchmarks vary significantly by product type and business model, which is why comparing your number against industry peers matters more than chasing a universal target.
-
Fast-moving consumer goods (FMCG): 15–30 days
-
Apparel and footwear; 60–90 days
-
Electronics: 30–60 days
-
Health and beauty: 30–60 days
-
Furniture and home goods: 90–120+ days
As a general rule, a lower DSI signals faster inventory turnover and leaner operations. A higher DSI isn’t always bad. It may reflect deliberate safety stock, long lead times, or seasonal demand patterns, but it does tie up working capital and increases the risk of dead stock.
The most useful benchmark is your own historical trend. If DSI is rising quarter over quarter without a clear reason, that warrants investigation.
How DSI Differs from Inventory Turnover
DSI and inventory turnover measure the same underlying dynamic from opposite angles. Inventory turnover tells you how many times you sell through your stock in a given period. DSI converts that number into days.
The relationship is direct: DSI = 365 ÷ Inventory Turnover Ratio
If your inventory turns over 6 times a year, your DSI is approximately 61 days. Some operators prefer turnover for its simplicity. others find DSI more intuitive because it maps to a concrete timeline. Both have their place in inventory management reporting.
When Should a Business Pay Close Attention to DSI?
DSI becomes especially important during periods of growth, product line expansion, or shifts in demand. A brand that is scaling quickly may see DSI creep upward simply because it’s stocking ahead of demand, which is manageable. But DSI rising alongside slowing sales is a warning sign that needs immediate attention.
It’s also worth tracking DSI by SKU rather than in aggregate. A blended number can mask the fact that certain products are sitting for 180+ days while others sell out in a week. SKU–level DSI feeds directly into reorder point calculations and helps prevent both stockouts and overstock situations.
Businesses running pick and pack fulfillment operations at scale will find DSI particularly useful when evaluating whether their storage footprint matches actual velocity, slow-moving SKUs in a fulfillment center drive up storage costs without generating revenue.
DSI as a Signal, Not Just a Score
Days sales of inventory is one of the clearest indicators of how efficiently a business is managing its stock. It connects purchasing decisions, warehousing costs, and cash flow in a single number.
Tracking it consistently and understanding what’s driving changes gives operations and finance teams the visibility they need to make smarter inventory fulfillment decisions before small inefficiencies become expensive problems.